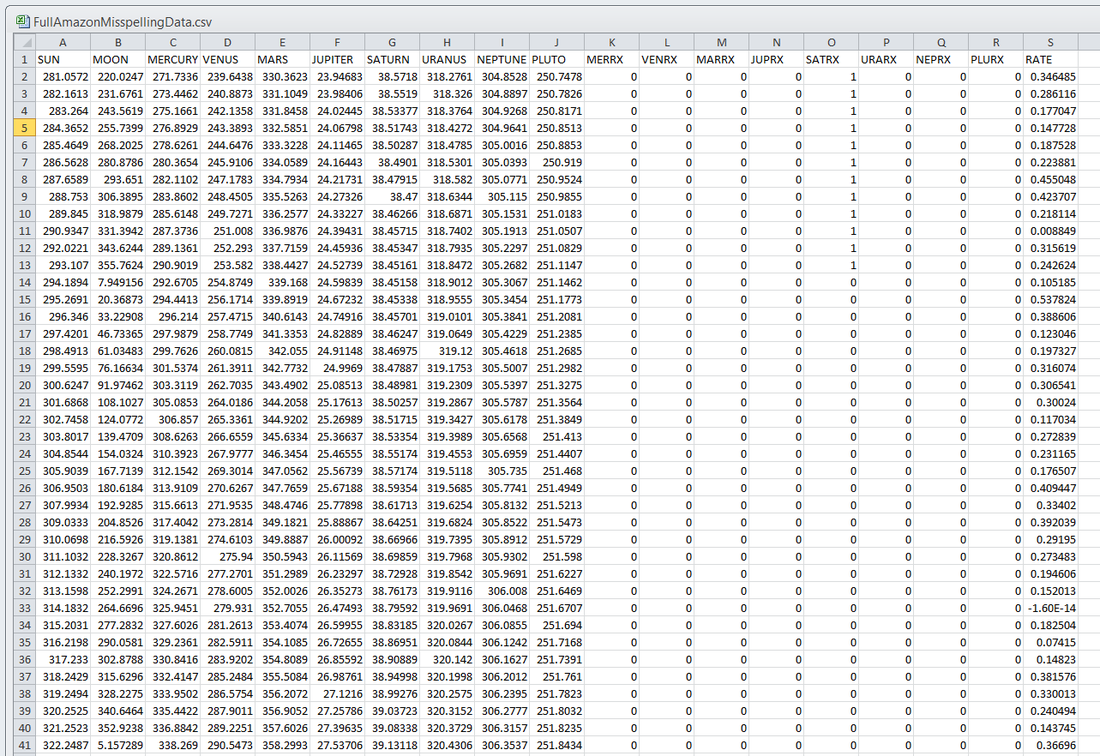
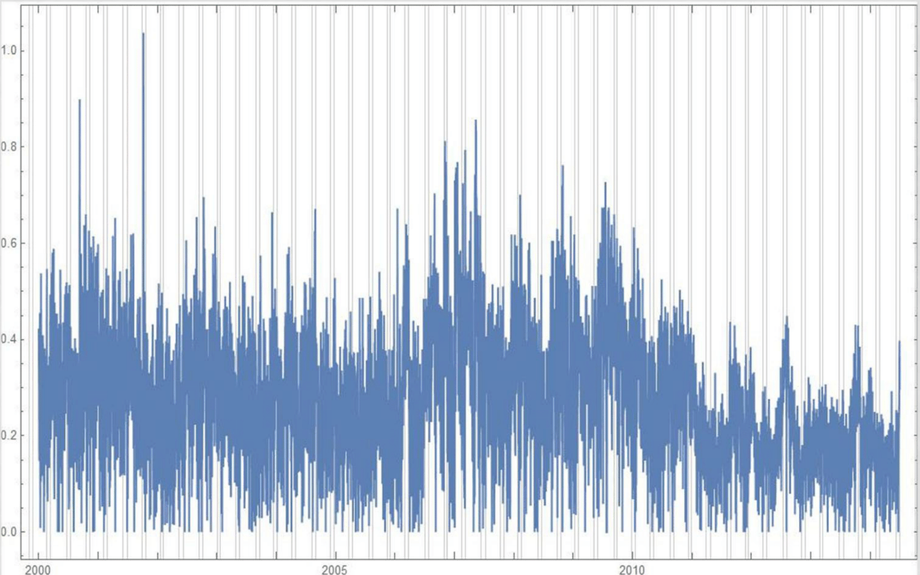
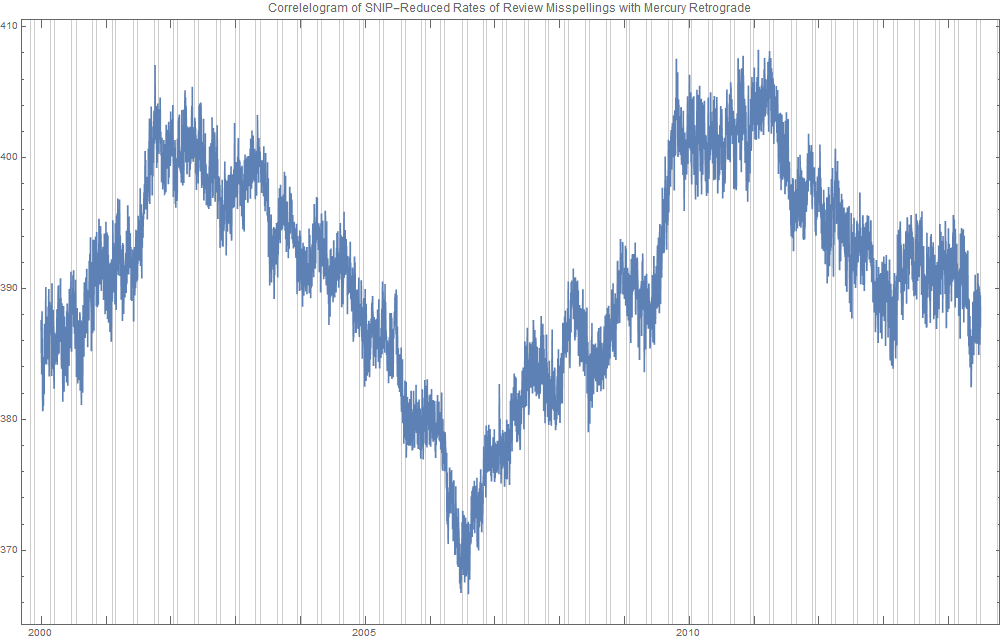
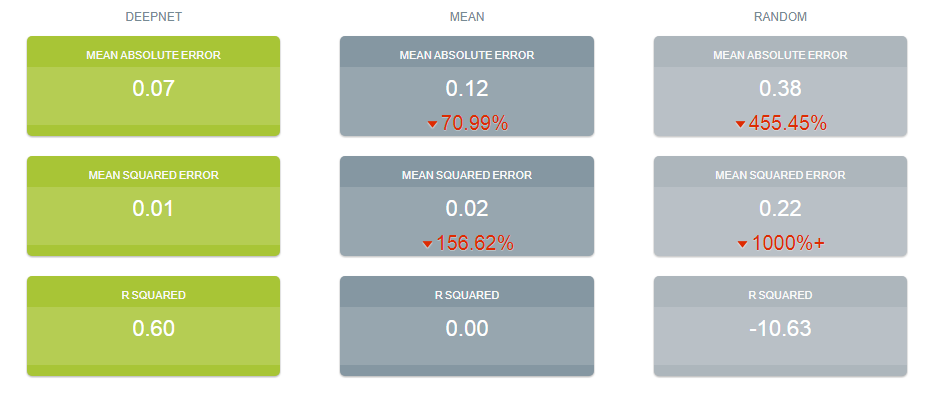
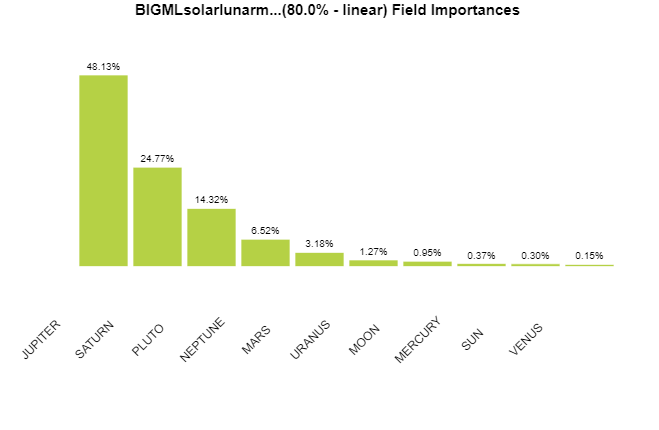
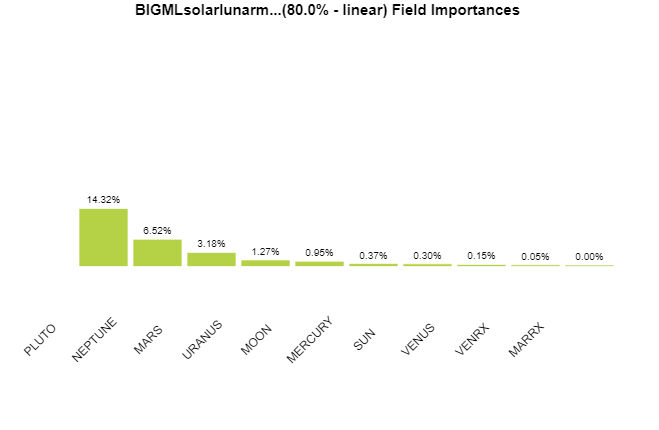
Ridiculously Good Results Again for the Amazon Misspelling Rates Data Using BigML's DeepNet2/19/2018 [Edit: The latest and greatest on this project, including source files, can be seen at the publication link here.] I have posted a few times here about a rich dataset that I have. Data were obtained from Stanford's SNAP data repository of Amazon.com reviews that gave daily misspelling rates; astronomical data were from Wolfram's Mathematica software and its astronomy resources. Here is what the dataset looks like. Click on each picture to enlarge. Each of the 5296 rows represents a sequential day in a 14.5 year span of Amazon review misspelling rates during Jan 1, 2000 to Jul 1, 2014. Across the top are the labels. In each column is a simple, stable, linear function of the right ascension (i.e., the astrological Tropical degree) of the planet, moon, or star at midnight at the start of that day in London, UK. Retrogressions of the planets are also included. The final column is the log of difference of the misspelling rate of the day from the 27-day SNIP baseline. (The Moon's right ascension completes its cycle every 27 and change days. That is the shortest cycle for any of the right ascensions.) Thus, it is the data over time minus its background noise. The following is a graph of this column's data over time. SNIP stands for Sensitive Nonlinear Iterative Peak-clipping algorithm. This method preserves any cyclic patterns -- such as the planetary placements and retrogressions -- while discarding "background noise" in the data, which would tend to obfuscate the patterns. The SNIP method is not subjective. It comes out of processing signals within spectra and is unprejudiced. Note that the SNIP method comes from signal processing and tends to preserve cyclic behavior in spectra. The apparent cyclicity hidden within this data is revealed via a correlelogram: The thin bands represent the start and end of Mercury retrograde across 14.5 years with Mercury retrograde analysis being the original motivator for acquiring this data. For today's study, the data for the first 80% of days were developed into a training group, and that of the subsequent 20% of days were isolated as a test group for prediction. What was doing the training and testing? They were done entirely by an automated machine learning (AI) algorithm from BigML.com called DeepNet. DeepNet* was applied to the training set of the first 80% of days. This DeepNet was then tested or evaluated on the last 20% of days. The DeepNet is a hands-off technique offered to anyone for free. The chart below displays ridiculously good results as given in the usual AI industry way: the error rates for predictions for the 20% test group by DeepNet (in green) is dramatically smaller than other standard methods of prediction, in gray, which are based on the mean (average) rate of the training data or an approach assuming random chance. Moreover, the strong R-squared suggests good correlation of predicted misspelling rates to actual values only for the astronomical data of the DeepNet. Let me summarize my take: future misspelling rates in Amazon reviews were successfully predicted using only basic astronomy data when compared to random values or when the average (mean) value was repeatedly applied. Moreover, similarly there was a fine fit of correlation of the model's predicted values to the actual values as shown by the R-squared. Here are the DeepNet fields in order of importance. I am not even sure what to do next, but in case you do, here is the spreadsheet.
Please let me know what is up, and please reference this post if you use the data set.
* For an instructable on exactly how I did this, see here. Note that a linear split was used.
12 Comments
Robin
2/21/2018 11:10:27 pm
You've done it again! Excellent. I greatly admire your work!
Reply
Renay
2/23/2018 10:29:00 am
Thanks Robin. That means a lot!
Reply
Bobilon
2/22/2018 07:47:41 pm
No need to post this -- the farthest I went mathmatically was econometrics 30 years ago and I wasn't particularly good at it then so what follows may is likely misinformed nonsense but you did cattle call ideas so here's my feeble attempt at this sirt of thinking, I'd run the trial you ran in different ways both on your initial data
Reply
Renay
2/22/2018 08:50:44 pm
Thanks B. I appreciate your intelligent comment.
Reply
Renay
3/1/2018 07:59:53 am
"To consider what this means": I take it you mean establishing astrology in general?
Reply
louise
2/22/2018 08:36:09 pm
Oh how silly smart!
Reply
Robin
2/22/2018 08:47:15 pm
I am glad Bobilon was able to comment. It is not easy, as sometimes it's not clear where to put comments! But if one tries placing the cursor here and there experimentally, it can be done.
Reply
Renay
2/22/2018 08:55:10 pm
Thanks Robin! You are right. The place in particular to put one's cursor to answer the CAPTCHA is right below the sentence after the picture that asks you for your answers. I have contacted host server tech support to no avail.
Reply
Robin
2/22/2018 08:52:09 pm
Sorry! Actually, the problem is not the commenting itself, but proving that one is not a robot. It's not readily apparent where to type in to copy the words from the images. Experimentation and persistence tend to win out!
Reply
3/23/2018 01:57:15 pm
Try using probability calculators. I knew there was a bias from Sun-Jupiter aspects on the Dow but didn't know what the odds were of reproducing it experimentally. The bias is only a couple of percent, but the odds of reproducing it over 600 samples is about 1%. (I used calculator.tutorvista.com for http://luckydays.tv/djAnalysis.txt)
Reply
Hi Adrian! I like your Dow Jones analysis. Maybe a good way of reproducing your probability would be through a Monte Carlo simulation? You would need a little bit of programming, but not much! If you want me to help you, I will!
Reply
Oh yeah, I should add that strictly speaking: the gold standard is not just the probability of your particular result but the SUM of getting your result plus all the more extreme (>48 out of 83 in your case) results. This is going to put you at closer to 50% likelihood, I believe. So, you may need a different approach.
Reply
Your comment will be posted after it is approved.
Leave a Reply. |
ARTICLESAuthorRenay Oshop - teacher, searcher, researcher, immerser, rejoicer, enjoying the interstices between Twitter, Facebook, and journals. Categories
All
Archives
September 2023
|
||||||
© 2008–2024 Renay Oshop AyurAstro®

 RSS Feed