|
Abstract
Contemporary astrologers are challenged like never before to make their work scientific. This is especially true for astrology researchers who are stewards of the keystone for legitimacy in astrology. Fortunately, current strides in artificial intelligence allow new avenues to data cultivation for the public and private astrology researcher. The author presents her freely available solution to the challenge, using in her explanation basic, intermediate, and advanced concepts. The Challenge Astrologers the world over from all times, whether Eastern, Western, Persian, Chinese, or Tibetan, face the same challenge. Event data of time, place, and date, including that of births, are mandatory for us to do our work. Acquiring that data is more difficult than at first blush it may appear. For example, if one is interested in sports astrology and one wants to know the start of a basketball or cricket match from five years ago, how does one actually find that? Perhaps there is an online news article from that time, but there are likely to be hidden problems. What I have found is that there is a wide variety among news publications as to how they treat such events. For example, BBC will include the time of the match in subsequent or preceding write-ups, while The New York Times will not. Another part of the challenge is the language used in an article. For example, the article may say something like “the match happened last Sunday”. The New York Times often uses such an approach, begging the questions of which Sunday is that and what is its date. It may be obvious to the contemporaneous online reader but not to one years thereafter. Then, there is a question of whether those articles are even archived and hence publicly accessible for some time later. Often, only the articles subsequent to an event are kept posted online and then only for a few years. Finally, there is the strong possibility of an astrologer not knowing that the event exists in the first place. For example, let’s switch our focus to cyclone event data. There was a cyclone in the Spring of 2019 named Cyclone Ida. There are hundreds of cyclones per year. (National Hurricane Center, 2019) Twenty years from now, will an astrologer who is interested in cyclones know to do an online search of contemporaneous literature for that particular cyclone? Will there still be material online for that cyclone? Doing astrological research is difficult. For the cyclone researcher, he or she may need to pore over tens of thousands of webpages just to get that kernel of truth of when, where, and what time a batch of cyclone events occurred. Reading that many documents takes time. Even if a list of ten thousand website URLs were presented instantly to the researcher, spending three minutes to scan each article would necessitate a solid 21 hours straight of such focused activity. That is not counting the search itself for the URLs or the recording of the results. Given these daunting facts, there is no wonder as to why astrological research is relatively rare and often scanty or incompletely done. Science, by contrast, demands first and foremost the relative accuracy and completeness of data. This core difference between astrological research and conventional science represents the deepest chasm between the two world perspectives. Bridging this chasm of data completeness would do the most to unify the work of all astrologers everywhere within the paradigm of science that could be said to define our current societies. The Solution A data challenge needs a data solution. The Information Age in which we live deluges us with data. Fortunately, in these times, we are being presented with newly hatched tools to automate the search for and the processing and retaining of data in bulk. The newest and best methods use artificial intelligence (AI). At this time, these AI tools are being used throughout every industry except astrology. These tools presently are also not for the mathematically faint of heart, so there is still a pretty steep learning curve for implementing them. Commercial industries find that the effort directed to the computational and mathematical gymnastics is more than worth it. The results are phenomenal, world-changing, and transforming to the industries even as the computer science in use is still relatively in its infancy. What is needed is a means of using these tools to help the future astrology researcher who is within that exponentiating global data deluge to find and record the relevant data that was previously preserved as it happened. Just as astrologers use books for transmission of knowledge, email for communicating with clients and each other, and software for chart generation, it is time for astrology to join the rest of professional society by investigating and employing the latest machine learning methods to generate artificial intelligence within astrology. Event data generation is the first order of business for the personal or public research astrologer. Using artificial intelligence on global public information to cultivate event data should be the first order of business for a current computer scientist who wishes to help astrology. Basic Ideas There are a few steps to a computer-automated processing of current event data to help a future astrologer. A computer program would be needed to 1. monitor daily current events as they are published in online articles. The computer program would then need to 2. linguistically digest the complex language of online news to find A. the nature of the event (for example, a new cyclone) and B. the date, time, and place of the event. After digestion, the computer program, at a minimum, would need to 3. preserve A. and B. for future use. The basic triplicate of requirements of monitoring, digestion, and preservation of astrologically relevant data in a timely manner is in truth a cascade of separate algorithms, or sub-programs, each of which has only been developed recently, sometimes as recently as just a few months ago. Monitoring can be done through a process called web scraping, wherein the texts of new articles are programmatically gleaned. However, of the millions of new articles that get published per day, which have data relevant to events of interest to the future astrologer? There is a computational cost to aggregating such monitored data. Even if the program takes but one second per article to seek out, acquire, and analyze for relevancy the text of the article, only 86400 such articles could be processed per day for this step alone. Thus, for current network, hardware, and software constraints, a necessary restriction in the numbers of internet sources and research topics is required. Digestion is the most technically challenging part of the three-step process. The computer program would need to do nothing less than understand language itself. Take this sentence as an example: “Last Sunday night, three hours after kickoff, the Chicago Bears won the Super Bowl championship against the Denver Broncos.” The program would need to know that A. the article is about a match in American football and B. what was last Sunday’s date. The location and time of kickoff would, one hopes, similarly be determinable through other sentences of the article. Digestion makes heavy use of something called natural language processing, a field of artificial intelligence that is still rapidly improving. The following two sections explore this step in some detail. Finally, preservation of the data in a central, publicly accessible repository is the last, necessary step to the program. This is the easiest step of the three and typically just requires publishing the data file online. Intermediate Ideas Natural language processing (NLP) across different languages and across different subjects is a wide computer science field with many compartments. The main ones of relevance here are automatic summarization, natural language understanding, and question answering. Automatic summarization is needed to determine whether an astrology research topic is indeed the topic of the article. Typically, this is done by condensing the article into a small summary and seeing if the topic is present therein. How does one determine the summary of an article? The non-trivial prospect of text extraction and synthesis based on statistical significance metrics and pattern-matching is a relatively straightforward type of summarization. These days, abstraction of language content is also often required as well. Machine learning based on linguistic feature extraction is at the core of this memory- and computation-heavy abstraction process. As a sub-field of NLP, automatic summarization benefits as being one of the longest studied topics of it. (Hahn & Mani, 2000) Natural language understanding is the study of how to improve comprehension of text by a computer. It is a necessary middle step to answering questions from the text. The reader may be familiar with interfaces for language understanding from Siri, Bixby, or Alexa apps on their cell phones. Such commonness belies the extraordinary technical achievement that they represent. For example, one may say “The man started on a new novel,” and “The man started on a sandwich”. The formal structure is identical even though the meanings are wildly different. Finally, question answering is critical to the astrologer’s needs. Even with the well-understood text of an article whose topic was deemed relevant, asking questions of the article is also non-trivial. Fortunately for astrologers, there are only three main questions. On what day did the event occur? At what time of day did the event occur? In what town did the event occur? However, the news article may be ambiguous on these matters or it may not include these details at all. For example, for a cyclone, what counts as the birth event? The initial early formation far off at sea? Landfall? Landfall only reaching a major population center? Such delicate domain-specific answering to a question is only lately, in the past few years or so, reaching maturity. Advanced Ideas The implementations of automatic summarization, natural language understanding, and question answering that are useful to know about for my project involve neural nets. Neural nets, a.k.a. artificial neural networks (ANN), are a way for the computer to solve problems of NLP that is lightly based on how biological animal brains work. Their loose depiction is as follows.
0 Comments
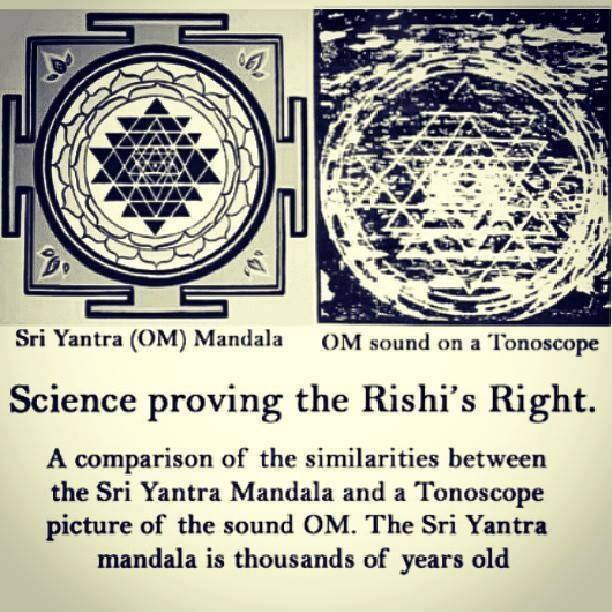
By reading the book Cymatics, many of us thrilled to the idea of vibration made visible in that gem of a book from the late 1960's.
With a few lines of code I have decided to plot the equations which go to heart of, and could be said to generate, these beautiful forms. More motivated me than just the chance to look directly at and witness the imagery. I have seen some claims that the Shri Chakra could be seen from these "tonoscopes". Click on image to see the presentation from The Kepler Conference for Astrological Research, Jan 2017. [Edit: a crazy further reduction in RMSE was achieved by finally using a neural net. The quick write-up of that can be seen here. A full journal article was just approved for publication (March 2018). It will be referenced in the bibliography.] To hear the audio of the misspellings, download the original file below and mouse over on the second red graph.
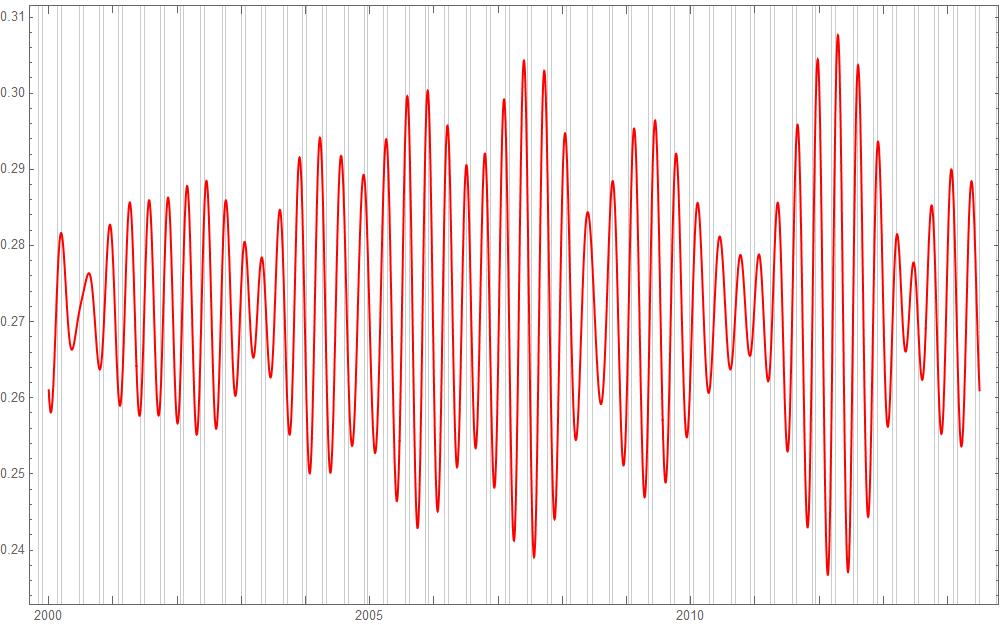
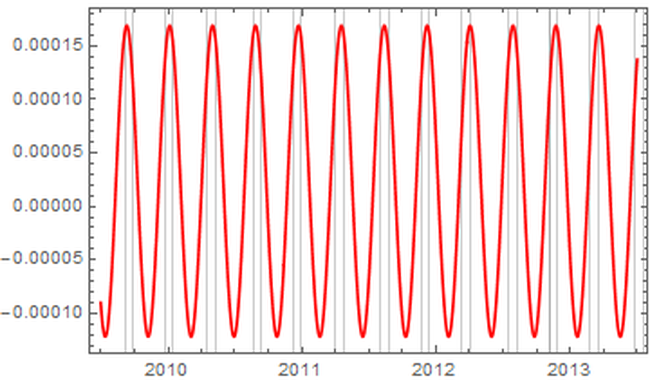
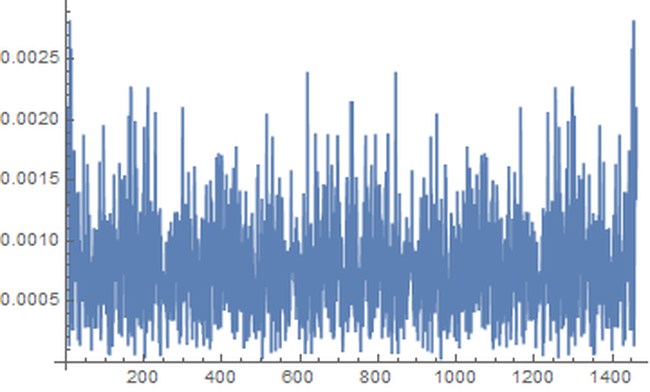
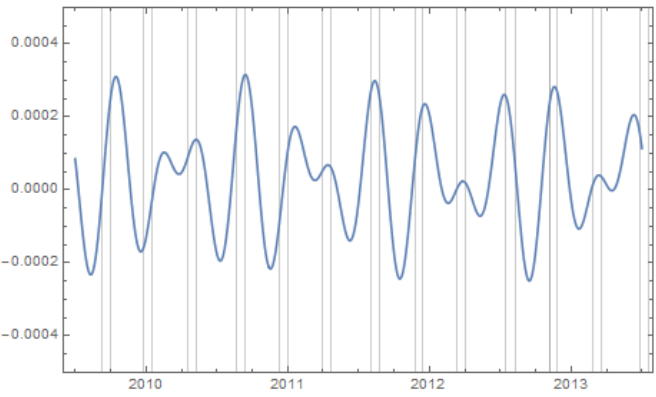
In a previous post, I described how non-dictionary word use in Amazon reviews peak in a periodic way in Mercury retrograde. I redid the analysis but also took out the common words "dvds", "DVDs", "apps", and "Apps" from consideration. (They would have been counted as misspellings before which I did not first realize.) I also applied the mean filter to a wider time frame, so that it would be more accurate in the window of July 1, 2009 to Jul 1, 2013: That was enough to reduce the peak at 9. (Perhaps, there was some kind of DVD and/or app release cycle that the 9 band referred to.) The result is that the fundamental in the transform is now at 13. That gives us the following for the fundamental wave: The peaks of this wave align very well with Mercury retrograde (demarcated by the gray bands), representing a regular increase of 613.789 percent from the average difference of blue actual value from gold general trend in the top picture during those times
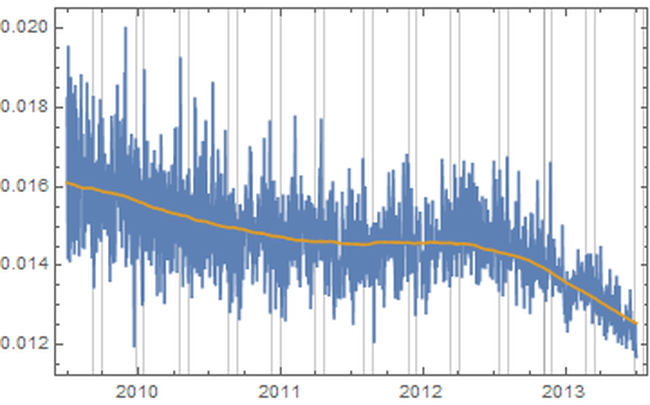
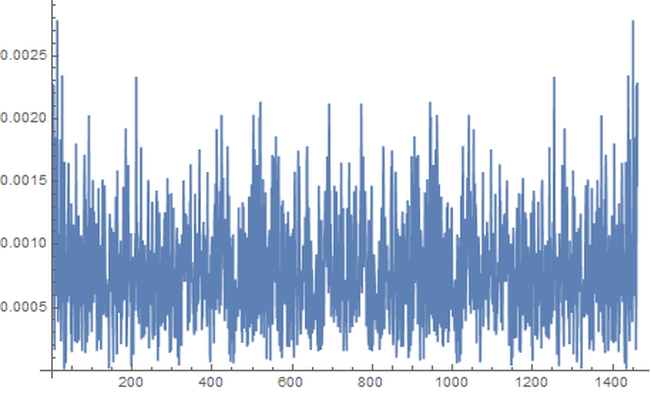
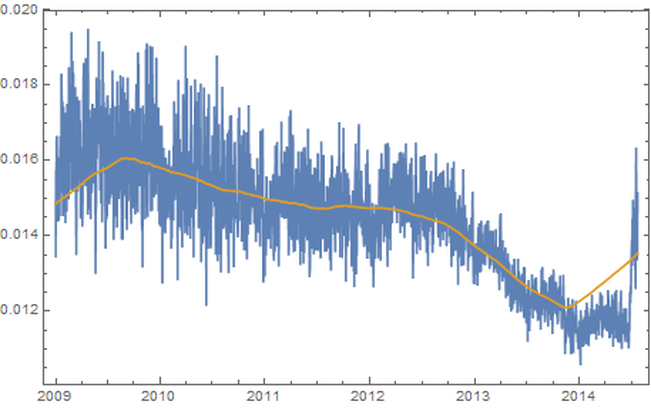
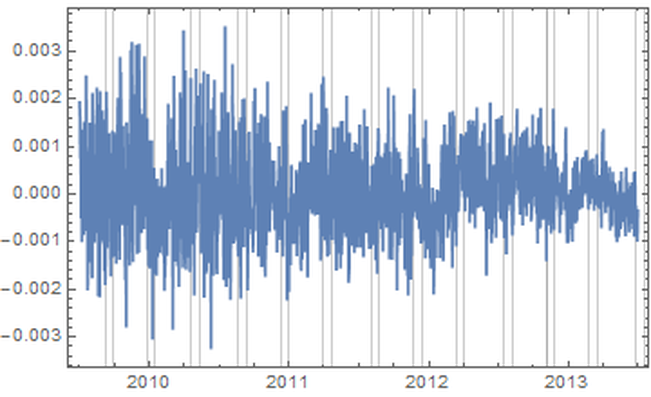
1. Introduction “Mercury retrograde” is, in my culture, a time of great concern. It is believed by many that the apparent astronomical retrogression affects human communication, travel, use of electronics, and thinking, among other broadly related things. To test the general thesis of an effect on communications during Mercury retrograde, I looked at a randomized 5% of a collection of 69,242,585 Amazon reviews posted between Jan 1, 2009 and July 23, 2014. (Amazon.com: Online Shopping for Electronics, Apparel, Computers, Books, DVDs & more n.d.) I counted the number of words per entry that are not in a computerized dictionary, while discounting digits, internet links, emoji, words with three or fewer characters. Non-English entries were also discarded. As well, not considered were context mistakes (such as there/their/they’re), grammar, punctuation, or capitalization errors. I wanted to simply approach comparing occurrences of larger non-dictionary words in Mercury retrograde seasons versus non-Mercury retrograde seasons. 2. Materials The source of the millions of Amazon reviews is a big data repository held by Stanford University. (Jure Leskovec and Andrej Krevl 2014) The Amazon data in particular is managed by Julian McAuley who kindly made it available to me for research purposes. (J. McAuley 2015) I chose an “aggressively deduplicated” version of the dataset that has no duplicated entries whatsoever. This data represents all 82.84 million Amazon product reviews with metadata to the date of July 23, 2014. 3. Methods The software Mathematica was used to implement standard data science and signal processing techniques. (Wolfram Research, Inc. 2015) The algorithms are publicly available. (Oshop, Zenodo 2015) First, the data was scrubbed of 16.04% of its 82,469,759 entries, as these proved to be nonstandard JSON (the main format of the database) and could not be evaluated by Mathematica itself. Since automating analysis of such a large dataset would be a primary key to any success, I was comfortable with the percentage lost. However, whether there is some important unifying theme to the lost entries, such as Amazon product department, time of submission, etc. is not known by me. Using such large datasets (here, 57 GB uncompressed) is still something of an art form, especially for an older dataset, even by the best operators of the best technologies. Thus, a table of 69,242,585 lines was built with two entries per line: the time of the original entry in Unix format and the review text, including edits. No record exists in this database of the timing of the edits to the review. Next, I programmed an evaluation that used a random number generator and the built-in dictionary to analyze a randomized choice of 5% of all entries. (DictionaryLookup Source Information—Wolfram Language Documentation n.d.) Each entry’s review was split into textual word substrings. To find emojis and links, the word strings had to be analyzed character by character. After that, if the dictionary found no match to the word string, it was counted as a “misspelling” in that entry. A sum of these entry misspellings was divided by the number of total textual words in the entry and the result was recorded along with the day of the original submission. Even with a randomized sampling of only 5%, running this program took about 31 hours on my desktop computer, at a rate of analysis on the order of 1,000 entries per second. Note that this technique would consider an unusual brand name of a product, for example, as a misspelling which would be introduced as a kind of noise to any more general trend. The resulting entries were grouped by date. A day’s group mean was recorded with that date and retained. These values for all dates in between January 1, 2009 and July 23, 2014, GMT, were built into a time series. A mean filter was applied to the time series, and the results were plotted along with it. The difference between the actual mean value for the day and the trend from the filter was found though subtraction and plotted. A variety of periodicities emerged. That variety was analyzed through a discrete Fourier transform. The main structure, coming from the contribution of the highest two values, was graphed and found to correspond well to the regular periodicity of Mercury retrograde. In the following pictures, the thin vertical bands mark the actual demarcations of Mercury retrograde, GMT, in that time frame. 4. Results A. Movement of Daily Averages The blue line describes the up and down movement of actual daily averages. The lighter gold line depicts the general trend. This general trend was obtained by a mean filter on the blue data. Because of the nature of a mean filter, the right and left end regions are not as accurate, which you can see in the above graph. They were excised from consideration. Accordingly, the following analyses include only date values between July 1, 2009 and July 1, 2013, still a rather long time length of four years. B. Differences of the Daily Averages from the General Trend The trend filter value (gold in Figure 1) was subtracted from mean filter value for each day (blue) and the result was plotted. These differences between actual daily value and the general trend were subjected to discrete Fourier transformation. The spectrograph is below. 1. Plot of Discrete Fourier Transform of Differences The fundamental first line is the highest at 9 along the horizontal axis, and the second major peak is at 13. With these numbers, along with their heights, we can construct the major course of the data, i.e., the wave that contributes the very most to the rise and fall of daily misspelling rates in Amazon reviews. 2. Construction of the Sum of Fundamental and First Major Harmonic As you can see, before each non-Mercury retrograde time marks the local and global minima of non-dictionary word use rate with a rise to the local and global maxima all occurring in Mercury retrograde. [Edit: If you like even cleaner data and would like to see an even more perfect graph, see this more recent post, where I improve the evaluation algorithm slightly but reasonably which was enough to change the fundamental to exactly Mercury retrograde.] 5. Discussion Looking much like software’s graph of an audio clip of the human voice, Figure 2 might at first seem fascinating but opaque to easy interpretation. In the case of the audio’s graph, the sound it represents is all in there, but how do you get from the visual picture back to the sound again? After all, recording, compressing, transmitting, and recreation of audio all happen from such software. There has to be a mathematical way, and there is. One of the major tools of science of the last one hundred years is the Fourier transform. Think of someone playing a pure middle C note on a perfect piano. The Fourier transform would break down that note to a graph much like Figure 3, only there would just be a single line on the left (with its mirror on the right), also called the fundamental: the one matching the frequency of middle C. In Nature, things tend to be more complicated. An actual piano would likely have rough, very minor sub-harmonics that build on and modify the major one. The major one would still have the exact shape of the sinusoidal wave of perfect middle C, but these rough minor frequencies would adjust that first dominant curve into a final wave form that is more complicated than, but resembling, a pure C note. This set of more minor notes would also appear on the Fourier transform plot, but as shorter lines and at placements along the horizontal axis that correspond to each of their frequencies. The heights give their order of modification of the first, fundamental note. Typically, the whole wave can be summarized in just a few lines. That is how compression and removal of noise in sound happens. Returning to the sound of the human voice, the complex stacking of a rich variety of sub-harmonics could still be teased apart by the wonder of the Fourier transform, but into dozens of lines. Similarly, looking at the wave form of Figure 3, there are dominant “notes” that can be pulled out, and the most fundamental, dominant one of all, the one that all others modify, is at a frequency band of occurring approximately once every 142 to 162 days, with a phase shift for the time window of -2.90338. This is the highest band at position 9. The major, first harmonic appears next in height (and strength of effect) at the 13 position which represents a frequency band of occurring approximately once every 111 to 115 days, with a phase shift for the time window of 1.05873, the very frequency and phase shift of Mercury retrograde itself in the time period being considered. Adding the fundamental and first harmonic together, we obtain a wave, and as seen in its graph in Figure 4, the lowest troughs of the wave all happen in between the periods of time also known as Mercury retrograde with the highest peaks all in Mercury Retrograde. 6. Conclusions The results of this study are still a ways away from proving that Mercury retrograde causes spelling errors, although, with this study, an important first step has been established. Herein is just proof that the period also known as Mercury retrograde is a uniform time of maximum periodic contribution to non-dictionary word use in the dataset, an increase that can be as high as 2.19%. If this small, but significant, error rate boost in a single act would hold across a series of them, then compounded across the thousands of small things that we do each each day, it would make one virtually sure to make a big mistake (one that is built from the small steps) during the 21 - 23 days of a Mercury retrograde period. A remarkable side note is that the two percent, statistically significant increase was the same found during Mercury retrograde for a completely unrelated database’s non-dictionary use rate during a completely different period. (Oshop, Across Millions of Entries, Reddit is More Likely to Show Misspellings During Mercury Retrograde in May 2015, 2015) There may still be some unknown market or cultural factor that has exactly the same periodicity and starting point as Mercury retrograde. If so, that would still suggest a tendency, actually an absolute correlation, to increased use of non-dictionary words during Mercury retrograde seasons. People who believe in some increased danger of error during that time would still be right. The poetic turn of phrase of the harmonics of the spheres may be no mere metaphor. Works Cited Amazon.com: Online Shopping for Electronics, Apparel, Computers, Books, DVDs & more. n.d. http://www.amazon.com (accessed 10 24, 2015). "DictionaryLookup Source Information—Wolfram Language Documentation." Wolfram Language & System Documentation Center. n.d. http://reference.wolfram.com/language/note/DictionaryLookupSourceInformation.html(accessed 10 24, 2015). Discrete Fourier Transforms—Wolfram Language Documentation. n.d. http://reference.wolfram.com/language/tutorial/FourierTransforms.html (accessed 10 25, 2015). J. McAuley, R. Pandey, J. Leskovec. "Inferring networks of substitutable and complementary products." Knowledge Discovery and Data Mining, 2015. Jure Leskovec and Andrej Krevl. {SNAP Datasets}: {Stanford} Large Network Dataset Collection. June 2014. http://snap.stanford.edu/data (accessed 10 24, 2015). Oshop, Renay: - Across Millions of Entries, Reddit is More Likely to Show Misspellings During Mercury Retrograde in May 2015. 10 10, 2015. http://www.ayurastro.com/articles/across-millions-of-entries-reddit-is-more-likely-to-show-misspellings-during-mercury-retrograde-in-may-2015 (accessed 11 2, 2015). — (2015). Non-Dictionary Words Occur More Often in Amazon Reviews During Mercury Retrograde. Zenodo. DOI: 10.5281/zenodo.32847 Wolfram Research, Inc. Mathematica. Version 10.2. Champaign, IL: Wolfram Research, Inc., 2015. |
ARTICLESAuthorRenay Oshop - teacher, searcher, researcher, immerser, rejoicer, enjoying the interstices between Twitter, Facebook, and journals. Categories
All
Archives
September 2023
|
||||||
© 2008–2024 Renay Oshop AyurAstro®


 RSS Feed