Earthquake Predictor Based on Planetary Apparent Magnitudes
For entertainment only.
All dates are in UTC time zone. Please wait about 10 seconds for information to load in the screen.
Predictor is based on USGS data from Jan 1, 2010 to Oct 7, 2023.
You can confirm USGS data here. You can confirm the prediction history by stopping back here often.
A nearest neighbor classifier was built based on Moon, Mercury, Venus, Mars, Jupiter, Saturn, Uranus, Neptune, and Pluto daily values of apparent magnitude as input and true or false incidence of one or more of a 6.5+ earthquake for the day from USGS data as output, all from Jan 1, 2010 to Oct 7, 2023. The inspiration for using apparent magnitudes was this early study of mine of earthquake incidence and the Moon's light. Upon finishing that quick study, I found that this similar study was published in Nature just over a year prior!
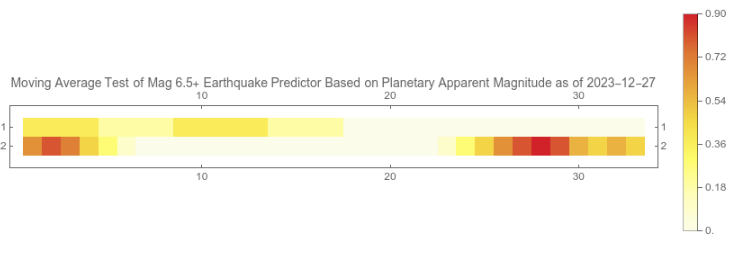
Because earthquake swarms tend to occur in clusters across space and time with a swarm geometric mean duration of 5 days, a 5-day moving average was chosen for both the true (1) or false (0) incidence in a day of actual earthquakes (top row) and predicted ones (bottom row) in a heat map below for data starting on Nov 21, 2023. Days progress along the x-axis with the first day of the moving average represented by the first column, the next day by the next column, and so on. If a day's prediction contained both true and false, 0.5 was used for that day in the prediction moving average calculations instead of 0 or 1. I would like to see the colors (including white) of the top row more-or-less match that of the bottom row.
Current Pearson's correlation coefficient between the actual and predicted moving average series (top and bottom rows) is -0.178507.
A priori, for a speculative correlation of 0.30, the number of samples needed to constrain the chance of a type 1 false positive to under 5% and the chance of a type 2 false negative to under 10% is 90. Thus, predictions will continue at least until Feb 20, 2024, at which point the final Pearson's correlation coefficient and 95% confidence interval will be published here. If all goes well, a write-up will be published in a journal, too.

