|
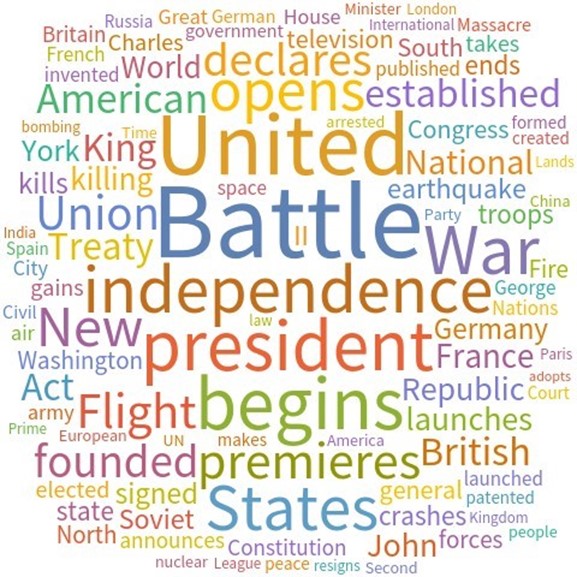
Abstract Embeddings, a way to measure similarities between texts, are a recent gift of machine learning. They were used here to quantify similarities in very short descriptions without dates of pairs in 7153 world events post-1600 AD as found in a provided database. There are 25,579,128 unique such possible pairs. The zodiacal placements of the charts were also calculated for either the actual date at midnight of the event or the same but using the start date for a multi-day event. Only Sun, Moon, Mercury, Venus, Mars, Jupiter, Saturn, Uranus, Neptune, Pluto, North Lunar Node, and South Lunar Node Tropical degree placements from zero to 360 degrees were computed. Adding up the Cosines of the differences between planetary placements for two events offers a neat and novel way of measuring similarities between these zodiacal placements for the two events. Thus, I have metrics for textual similarities and chart similarities. The imagery of these metrics plotted against each other suggests non-monotonic dependence. This study answers a precise question: what is the p-value for independence between the two metrics? The upper p-value for independence is less than 0.01 as computed by Hoeffding’s dependence measure. The conservative Monte Carlo approach to estimating the upper value of this p-value was necessary due to physical computation constraints. Thus, likelihood for the alternative to independence, namely dependence, between event textual similarities and event chart similarities is established. A separate Hoeffding's dependence measure for each celestial feature is calculated for the special case of event distances to the word "Battle". A Monte Carlo simulation shows that these separate Hoeffding's D measures are mostly extremely unlikely given the distributions of celestial degrees in the data. Wolfram language code and data are included. Introduction World events are often used in astrology studies. Accurate place, date, and time are typically known even when they are not precise, allowing for a bridge between astrological placements and interpretation of social, cultural, and personal significations. Rarely however do these studies include enough events to achieve statistical significance for the interpretations drawn. Instead, I posit a more general and more foundational hypothesis: across many millions of pairs of events, is the magnitude of difference in textual descriptions (which contain words loaded with social, cultural, and personal significance) related to magnitude of difference in astrological charts for the two events? I will be exploring quantitative equivalencies for most of the concepts within this question and then use appropriate mathematics to answer it. Materials and Methods All of the calculations in this study were performed through the professional mathematics software, Mathematica, which offers many tools, one of which is a database of 7818 historical events.[1] Included in the database is a one sentence text-description (eg "Apollo 8 Returns to Earth") and start date (eg Dec 27 1968). Source information and metadata is not available for this database beyond assurances that it is continually being updated.[2][3] Unfortunately, this database is largely anglophone-centric, but alternatives are hard to come by as more general event databases are surprisingly hard to access. The first step to cultivating the data was the choice to include only events that took place at and after the year 1600 AD. The reasoning is that there was a calendrical revolution with the introduction of the Gregorian system around year 1582 with delays in adoption in some cultures that took many years. This restriction of date pares the 7818 events down to 7153 events. A timeline plot of the events follows. Next, I removed all numbers in the database event descriptions, because I do not want to connect similarity between eg “The Battle of 1812” and another event that may have the year 1812 in its description. (So, “The Battle of 1812” is reduced to “The Battle of”.) To not do this would allow de facto some correspondence of text description and chart placements which I want to avoid. Care was also taken to assure that there were no duplicates in the event database. A word cloud of the most common words in the resultant event descriptions follows.
For pair construction, 7153 options are available for the first event and 7152 are available for the second event. Multiplying these and dividing by two to erase repetition yields 25,579,128 possible unique pairs. The following analysis is applied to each pair.
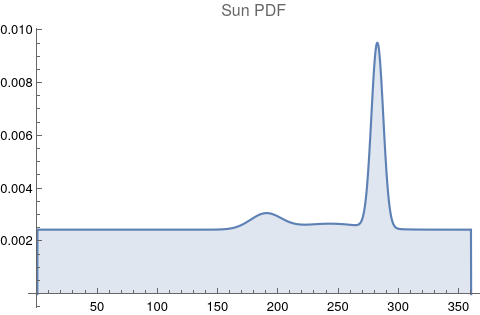
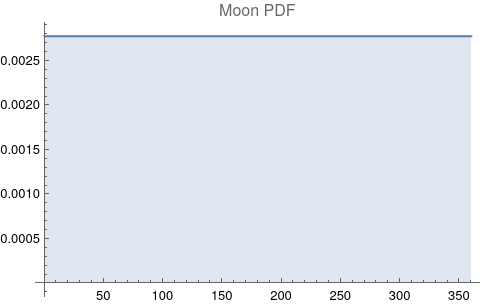
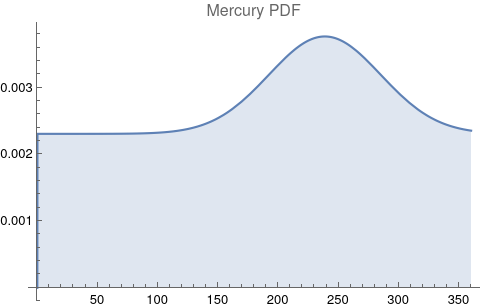
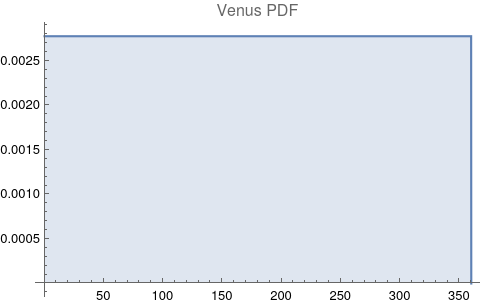
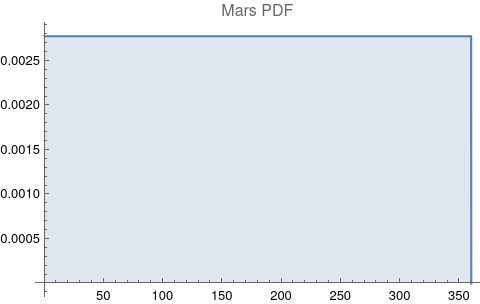
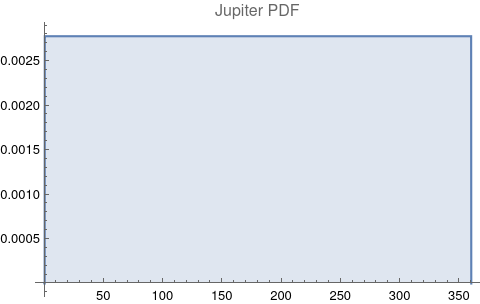
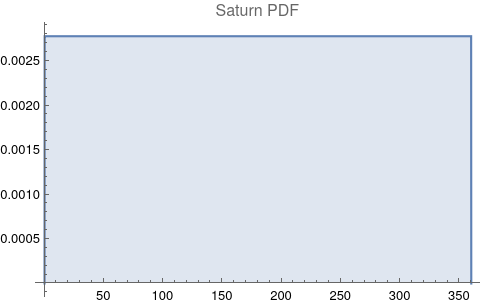
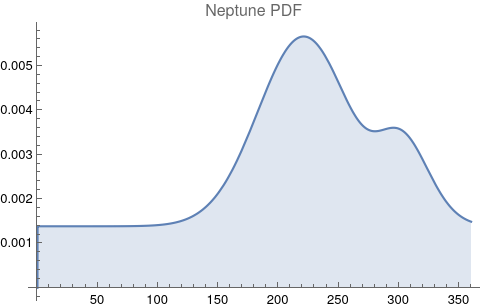
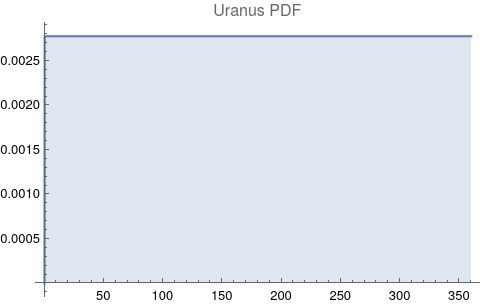
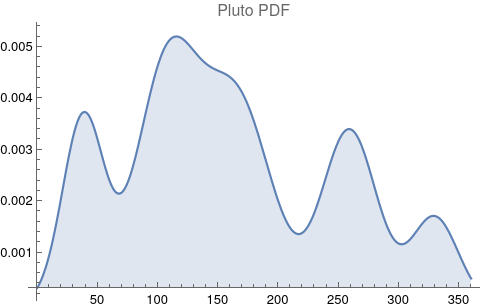
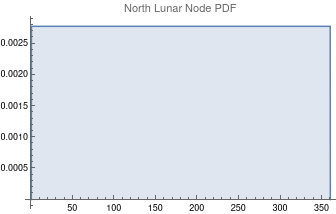
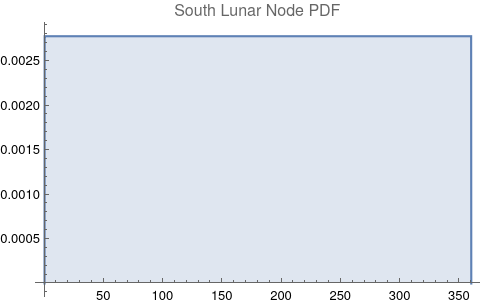
The questions for each pair are: a. “How exactly similar are their textual descriptions?”, b. “How exactly similar are their planetary placements?”, and c. “Do these two similarities correspond to each other?” For a. only since early 2000’s AD is there a way to more precisely measure this trait of qualitative texts. Embeddings were introduced in 2003 in a paper that states that they “associate with each word in the vocabulary a distributed word feature vector … The feature vector represents different aspects of the word: each word is associated with a point in a vector space. The number of features … is much smaller than the size of the vocabulary”.[4][5] These embeddings embody a literal “geometry of meaning”.[6] To share an example from popular computer science literature, subtracting the embedding numbers for "man" from those for "king" and then adding those for "woman", one gets the numbers that closely align with "queen".[7] So, king - man + woman = queen. The particular calculator for embeddings used for this study was developed by Google Research, Inc., was released in 2018, and is called Bidirectional Encoder Representations from Transformers (BERT).[8] It results in a vector, a list, that is 768 numbers long for each event description. The similarity metric between two event descriptions is simply the dot product of their 768-number-long vectors.[9] Decapitalization did not affect the calculations. Next is the assignment b. to compare the Tropical zodiac placements for the dates of each event pair and have a similarity measure. These geocentric ecliptic longitude placements are values between 0 degrees and 360 degrees and are also the degree placements used in Tropical astrology. For each event there are separate degrees for Sun, Moon, Mercury, Venus, Mars, Jupiter, Saturn, Uranus, Neptune, Pluto, North Lunar Node, and South Lunar Node, thus creating a 12-number-long vector for each. Descriptive plots for the probability distribution function (PDF) of each celestial feature as a function of degrees follow.
There are obvious spikes for some of these features. Perhaps the dramatic increase in the high 200's for the Sun degrees is most surprising. (There may be more public news events in the northern hemisphere's late autumn and early winter when the Sun would be yearly at these degrees. For example, events around the USA Thanksgiving and Christmas holidays may register more as news-worthy.)
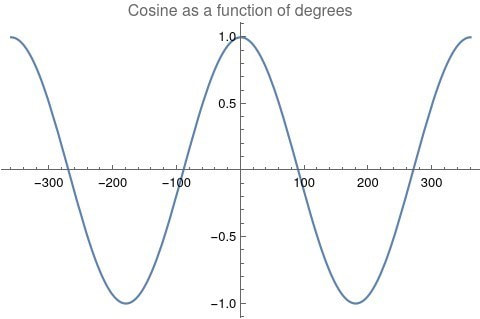
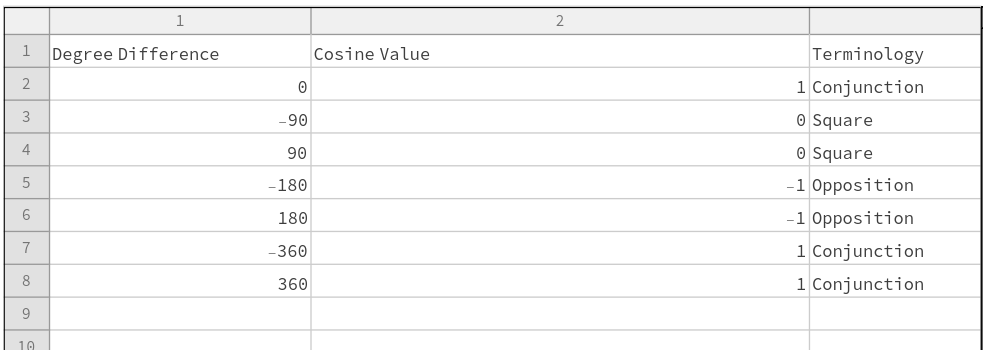
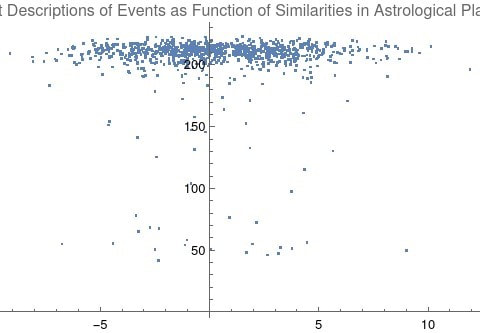
Comparing the 12-digit vectors for these zodiacal placements could be done by dot product too, but that would miss some very important features of astrology charts. We consider charts to be similar or conjunct when their degree differences, ie the results of their degrees’ subtractions, are either close to zero or close to 360 degrees or -360 degrees. Nicely enough, there is a trigonometric function that behaves exactly this way: the cosine. The simple plot of it follows, wherein you can see that the blue line has maxima at 0 degrees, 360 degrees, and -360 degrees. Moreover there are other qualities of the cosine curve that preserve information from astrology. Oppositions at +/- 180 degrees are at -1, and +/-90 degree squares hold a value of zero. These parallel astrological interpretation wherein squares suggest no similarity, and oppositions do show similarity but of an opposite polarity as conjunctions. Degrees in between the extrema have cosine values that are appropriately in between as well. Thus for each of the two events in an event pair, the twelve placements of the second one was subtracted from those of the first one. Applying cosine to each of the twelve differences and then doing a simple summation gives a single-number result that is a straightforward but robust metric for the 12-planet chart similarities. Next is c., the assignment of detecting dependence. Note that this is different than correlation. For example, a quartic is a function of the order of x raised to the fourth power. The resulting graph shows for each x one f(x), but it is not so that each f(x) only corresponds to one x. Parabolas, hyperbolas, and certain trigonometric functions such as cosine depicted above behave similarly. Thus, one can say for these that f(x) is indeed a function of x, but not in a monotonic fashion. The idea of monotonic dependence is also known as correlation, but for these special non-monotonic functions, we need to consider tests for dependence and not correlation. In short: For dependency: determine that a variable has a value that depends on the value of another variable. For correlation: the relationship between variables is linear and is considered as correlation. That is, as one similarity increases the other uniformly increases or decreases too. This paper’s study answers a question not about correlation but about the more sophisticated situation of dependence. To do the answering, I wanted a tool that can compute not just linear dependence (ie correlation) but also non-linear dependence.[10] Hoeffding’s D (for dependence) measure was selected. Each Hoeffding D measure test was found to take about 16 seconds to compute for 100,000 event pairs, 22 minutes for 1,000,000 event pairs, and an unknown amount for the full event pairs that number over 25 million. The latter is unknown because the computation was aborted after six days. (The computer that was used is running Linux on an AMD 3950x CPU with 64 GB DDR4 RAM.) Thus, a Monte Carlo approach was needed in order to estimate the upper-bound “p-hat” of the actual full p-value for independence. The approach consists of breaking up the problem into computing the p-value 100 different times for randomized sets that number 1 million pairs each. The equation for this conservative upper bound is simply (r + 1)/(n + 1), where r is the number of runs that yield a test-statistic above that which is desired (here corresponding to a p-value of 0.05) and n is the number of different times the randomization is run (here equal to 100).[11] All that is needed is r. Results The computations of n = 100 randomized runs resulted in an r value of 0. Therefore, the p-value upper bound, also known as p-hat, is: (0 + 1)/(100 + 1) or 0.0099 < 0.01**. In fact, for every one of the 100 runs of 1 million randomly selected pairs, the computed p-value was smaller than the smallest number the software can handle, 6^-1355718576299610, and for each of those 100 runs, a plot of event pair description similarities as a function of chart similarities was made. The following is a movie of the 100 plots in sequence. Note the boundaries at x = +12, x = -12, y = 0, and y = around 250. These correspond to extremely similar charts, extremely dissimilar charts, dissimilar text descriptions, and similar text descriptions respectively.
To make it somewhat simpler to see the relationship, here is an example picture with just 1000 random pairs to show a general shape.
A likely dependent relationship between similarities in historical event text descriptions and similarities in historical event chart placements is thus established.
Example Case of Looking at a Specific Word, "Battle" Calculating Hoeffding's dependence between each individual celestial feature and the 7153 distances to any given keyword is computationally tractable, even while computing across all keywords is not. The following is a demonstration using the most frequent keyword in the event descriptions, "Battle".
To see how likely the resulting dependence measures are, a second, more specific Monte Carlo simulation of 10000 sets with 7153 randomized charts in each set was used to calculate p-values. The randomizations were distributed according to the PDFs of each celestial feature.
Celestial Feature Hoeffding's D Monte Carlo P-value Sun 0.015 << 0.00001 Moon 0.62 << 0.00001 Mercury 0.006 << 0.00001 Venus 0.013 << 0.00001 Mars 0.042 << 0.00001 Jupiter 0.15 << 0.00001 Saturn 0.068 << 0.00001 Neptune 0.47 << 0.00001 Uranus 0.01 << 0.00001 Pluto 0.13 << 0.00001 North Lunar Node 0.00 0.47 South Lunar Node 0.00 0.26
Conclusions
In this paper, similarities in historical event descriptions are shown to be most likely a function of chart similarities with an estimated p-value upper limit for independence that is under 0.01. A relationship between astrological chart similarities and event description similarities seems to exist. This relationship could well be employed to allow for event prediction based on a future day's projected geocentric astronomical placements. Correspondence and not correlation was the focus as it appears in list plots that the state of textual similarities vary as a function of chart similarity. There are some interesting connections to make from the plots of the two similarities. First, there is some imperfect symmetry across the y-axis, saying that very large positive-number chart similarities (indicating all close conjunctions) can behave somewhat like very large negative-number similarities. The latter would occur when the twelve degree differences are all close to 180 degrees, ie when there are strong oppositions. That too is considered a strength between two charts, so this may be some empirical support for that belief in astrology. In the example of pinning event description distance to the keyword "battle", the dependence measures of the nodes are not statistically significant, but everything else is. Moon and Neptune exhibit greatest dependence measures for "battle" which is astrologically surprising. Some readers may be concerned that Neptune's dependence measure is high in that example, because it moves so slowly and hence may be associated with an era in time, ie an era with more battles. That is where the second Monte Carlo significance comes in very handy. It tells us that, given the probability distribution for Neptune, the natural occurrence of such a high dependency measure is extremely unlikely. As well, note that Uranus and Pluto do not show high dependence measures in this case, even though they move as slow or even slower than Neptune. Moreover, the pre-eminence of the very quick-moving Moon and its uniform PDF negate the concern altogether. Code is available, including for the generation of data.[12] Works in Progress To continue this study, work on the following has commenced.
References 1: Wolfram Research, EventData, 2012, https://reference.wolfram.com/language/ref/EventData.html 2: Wolfram Research, Wolfram Knowledgebase, 2022, https://www.wolfram.com/knowledgebase/ 3: Wolfram Research, Frequently Asked Questions, 2022, https://www.wolframalpha.com/faqs/ 4: Bengio Y., Ducharme R., Vincent P., and Jauvin C., A Neural Probabilistic Language Model, 2003, Journal of Machine Learning Research, 1137–1155, https://www.jmlr.org/papers/volume3/bengio03a/bengio03a.pdf 5: Aylien.com, An overview of word embeddings and their connection to distributional semantic models, 2022, https://aylien.com/blog/overview-word-embeddings-history-word2vec-cbow-glove 6: Gärdenfors P., The Geometry of Meaning, 2017, MIT Press, https://mitpress.mit.edu/books/geometry-meaning 7: MIT Technology Review, King - Man + Woman = Queen: The Marvelous Mathematics of Computational Linguistics, 2015, https://www.technologyreview.com/2015/09/17/166211/king-man-woman-queen-the-marvelous-mathematics-of-computational-linguistics/ 8: Wolfram Research, BERT Trained on BookCorpus and Wikipedia Data, 2022, https://resources.wolframcloud.com/NeuralNetRepository/resources/BERT-Trained-on-BookCorpus-and-Wikipedia-Data/ 9: Google Research Inc., Measuring Similarity from Embeddings, 2022, https://developers.google.com/machine-learning/clustering/similarity/measuring-similarity 10: de Siqueira Santos S., Takahashi D., Nakata A., and Fujita A., A comparative study of statistical methods used to identify dependencies between gene expression signals, 2013, Briefings in Bioinformatics, 1-13, https://www.princeton.edu/~dtakahas/publications/Brief%20Bioinform-2013-de%20Siqueira%20Santos 11: North, B. V., Curtis, D., and Sham, P.C., A Note on the Calculation of Empirical P Values from Monte Carlo Procedures, 2002, American Journal of Human Genetics, 439 - 441, https://www.ncbi.nlm.nih.gov/pmc/articles/PMC379178/ 12: Oshop R., Is Textual Similarity of Events Related to Event Chart Similarity?, 2022, www.wolframcloud.com/obj/renay.oshop/Published/Events%20comparisons%20published.nb
A basic video run-through of the above material follows.
0 Comments
The following is from a presentation I gave to the Colorado Ayurvedic Medical Association a couple of years ago. Download it at the link immediately below or see the Scribd file that follows.
|
ARTICLESAuthorRenay Oshop - teacher, searcher, researcher, immerser, rejoicer, enjoying the interstices between Twitter, Facebook, and journals. Categories
All
Archives
September 2023
|
||||||
© 2008–2024 Renay Oshop AyurAstro®



 RSS Feed