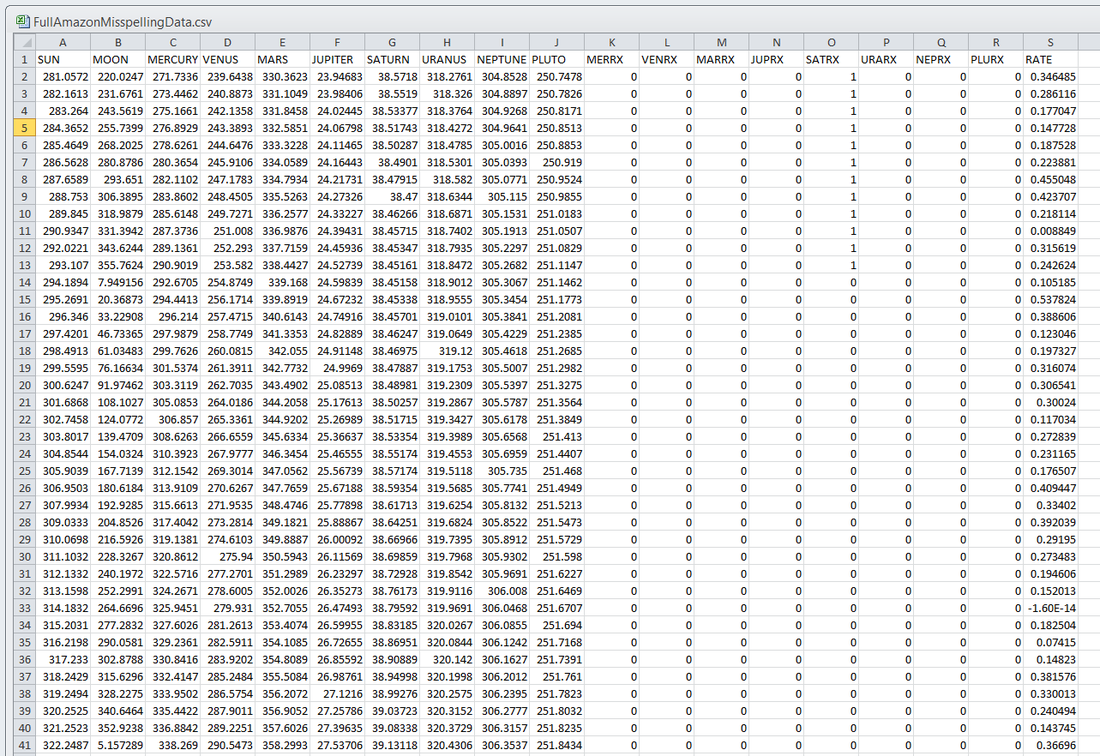
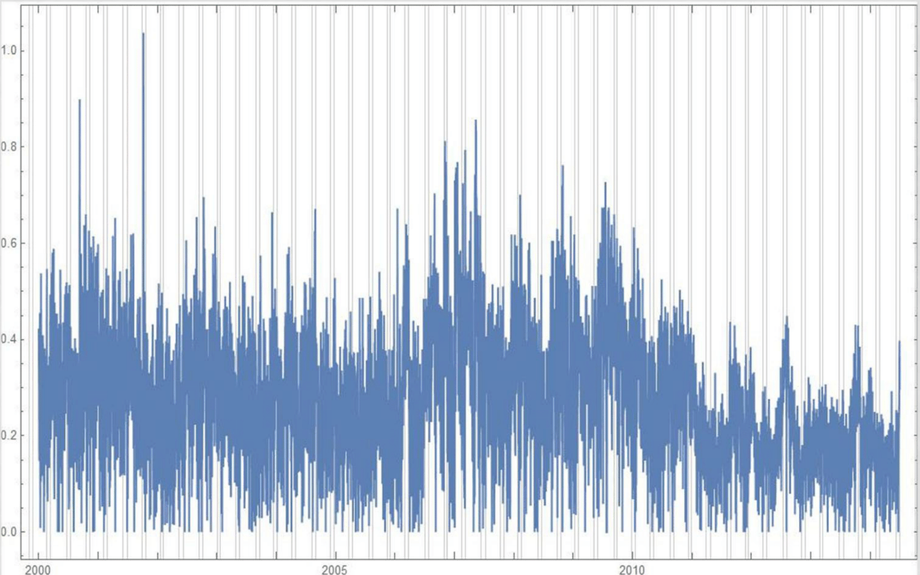
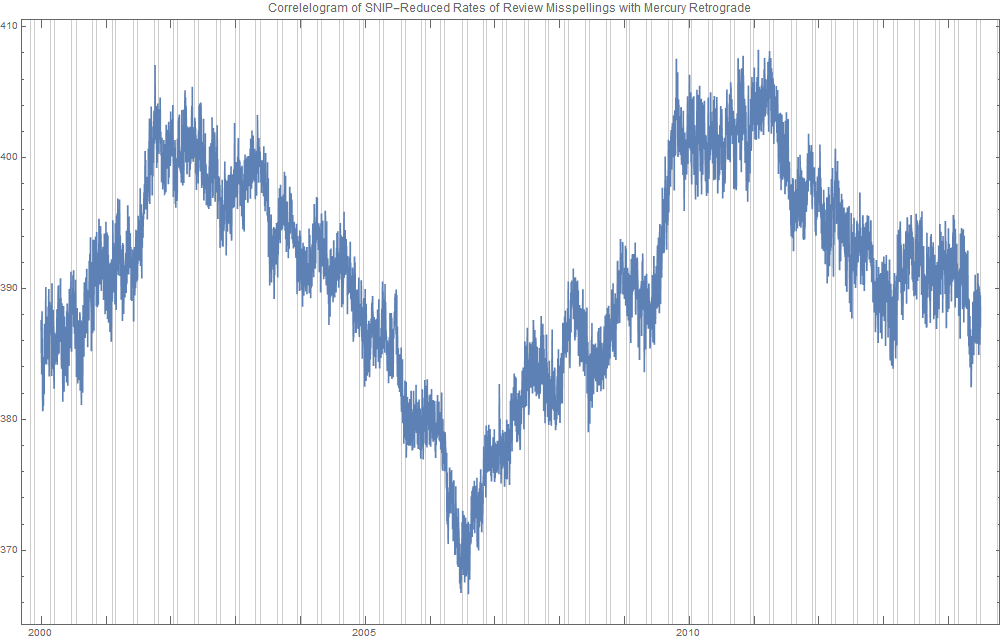
Ridiculously Good Results Again for the Amazon Misspelling Rates Data Using BigML's DeepNet2/19/2018 [Edit: The latest and greatest on this project, including source files, can be seen at the publication link here.] I have posted a few times here about a rich dataset that I have. Data were obtained from Stanford's SNAP data repository of Amazon.com reviews that gave daily misspelling rates; astronomical data were from Wolfram's Mathematica software and its astronomy resources. Here is what the dataset looks like. Click on each picture to enlarge. Each of the 5296 rows represents a sequential day in a 14.5 year span of Amazon review misspelling rates during Jan 1, 2000 to Jul 1, 2014. Across the top are the labels. In each column is a simple, stable, linear function of the right ascension (i.e., the astrological Tropical degree) of the planet, moon, or star at midnight at the start of that day in London, UK. Retrogressions of the planets are also included. The final column is the log of difference of the misspelling rate of the day from the 27-day SNIP baseline. (The Moon's right ascension completes its cycle every 27 and change days. That is the shortest cycle for any of the right ascensions.) Thus, it is the data over time minus its background noise. The following is a graph of this column's data over time. SNIP stands for Sensitive Nonlinear Iterative Peak-clipping algorithm. This method preserves any cyclic patterns -- such as the planetary placements and retrogressions -- while discarding "background noise" in the data, which would tend to obfuscate the patterns. The SNIP method is not subjective. It comes out of processing signals within spectra and is unprejudiced. Note that the SNIP method comes from signal processing and tends to preserve cyclic behavior in spectra. The apparent cyclicity hidden within this data is revealed via a correlelogram: The thin bands represent the start and end of Mercury retrograde across 14.5 years with Mercury retrograde analysis being the original motivator for acquiring this data.
For today's study, the data for the first 80% of days were developed into a training group, and that of the subsequent 20% of days were isolated as a test group for prediction. What was doing the training and testing? They were done entirely by an automated machine learning (AI) algorithm from BigML.com called DeepNet. DeepNet* was applied to the training set of the first 80% of days. This DeepNet was then tested or evaluated on the last 20% of days. The DeepNet is a hands-off technique offered to anyone for free. The chart below displays ridiculously good results as given in the usual AI industry way: the error rates for predictions for the 20% test group by DeepNet (in green) is dramatically smaller than other standard methods of prediction, in gray, which are based on the mean (average) rate of the training data or an approach assuming random chance. Moreover, the strong R-squared suggests good correlation of predicted misspelling rates to actual values only for the astronomical data of the DeepNet.
12 Comments
|
ARTICLESAuthorRenay Oshop - teacher, searcher, researcher, immerser, rejoicer, enjoying the interstices between Twitter, Facebook, and journals. Categories
All
Archives
September 2023
|
© 2008–2024 Renay Oshop AyurAstro®


 RSS Feed