|
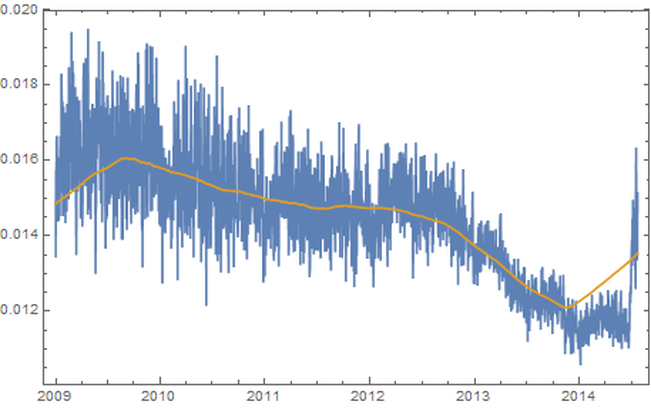
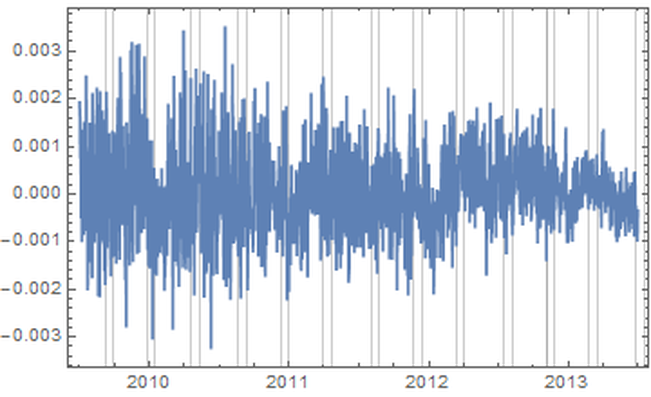
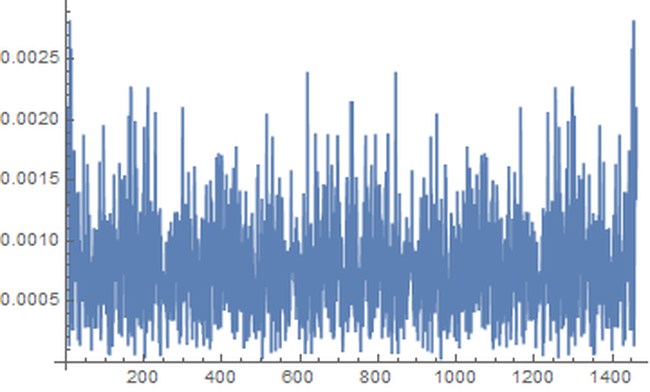
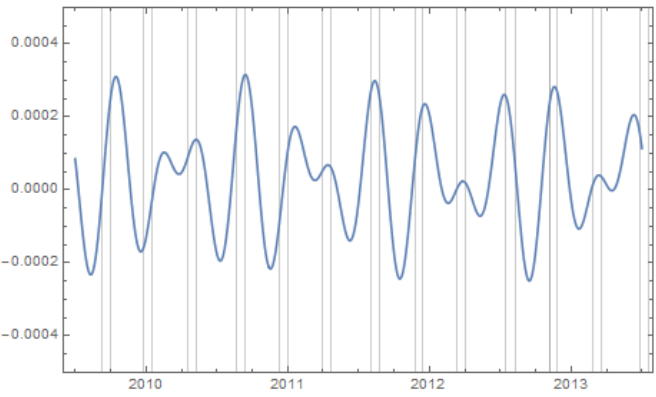
1. Introduction “Mercury retrograde” is, in my culture, a time of great concern. It is believed by many that the apparent astronomical retrogression affects human communication, travel, use of electronics, and thinking, among other broadly related things. To test the general thesis of an effect on communications during Mercury retrograde, I looked at a randomized 5% of a collection of 69,242,585 Amazon reviews posted between Jan 1, 2009 and July 23, 2014. (Amazon.com: Online Shopping for Electronics, Apparel, Computers, Books, DVDs & more n.d.) I counted the number of words per entry that are not in a computerized dictionary, while discounting digits, internet links, emoji, words with three or fewer characters. Non-English entries were also discarded. As well, not considered were context mistakes (such as there/their/they’re), grammar, punctuation, or capitalization errors. I wanted to simply approach comparing occurrences of larger non-dictionary words in Mercury retrograde seasons versus non-Mercury retrograde seasons. 2. Materials The source of the millions of Amazon reviews is a big data repository held by Stanford University. (Jure Leskovec and Andrej Krevl 2014) The Amazon data in particular is managed by Julian McAuley who kindly made it available to me for research purposes. (J. McAuley 2015) I chose an “aggressively deduplicated” version of the dataset that has no duplicated entries whatsoever. This data represents all 82.84 million Amazon product reviews with metadata to the date of July 23, 2014. 3. Methods The software Mathematica was used to implement standard data science and signal processing techniques. (Wolfram Research, Inc. 2015) The algorithms are publicly available. (Oshop, Zenodo 2015) First, the data was scrubbed of 16.04% of its 82,469,759 entries, as these proved to be nonstandard JSON (the main format of the database) and could not be evaluated by Mathematica itself. Since automating analysis of such a large dataset would be a primary key to any success, I was comfortable with the percentage lost. However, whether there is some important unifying theme to the lost entries, such as Amazon product department, time of submission, etc. is not known by me. Using such large datasets (here, 57 GB uncompressed) is still something of an art form, especially for an older dataset, even by the best operators of the best technologies. Thus, a table of 69,242,585 lines was built with two entries per line: the time of the original entry in Unix format and the review text, including edits. No record exists in this database of the timing of the edits to the review. Next, I programmed an evaluation that used a random number generator and the built-in dictionary to analyze a randomized choice of 5% of all entries. (DictionaryLookup Source Information—Wolfram Language Documentation n.d.) Each entry’s review was split into textual word substrings. To find emojis and links, the word strings had to be analyzed character by character. After that, if the dictionary found no match to the word string, it was counted as a “misspelling” in that entry. A sum of these entry misspellings was divided by the number of total textual words in the entry and the result was recorded along with the day of the original submission. Even with a randomized sampling of only 5%, running this program took about 31 hours on my desktop computer, at a rate of analysis on the order of 1,000 entries per second. Note that this technique would consider an unusual brand name of a product, for example, as a misspelling which would be introduced as a kind of noise to any more general trend. The resulting entries were grouped by date. A day’s group mean was recorded with that date and retained. These values for all dates in between January 1, 2009 and July 23, 2014, GMT, were built into a time series. A mean filter was applied to the time series, and the results were plotted along with it. The difference between the actual mean value for the day and the trend from the filter was found though subtraction and plotted. A variety of periodicities emerged. That variety was analyzed through a discrete Fourier transform. The main structure, coming from the contribution of the highest two values, was graphed and found to correspond well to the regular periodicity of Mercury retrograde. In the following pictures, the thin vertical bands mark the actual demarcations of Mercury retrograde, GMT, in that time frame. 4. Results A. Movement of Daily Averages The blue line describes the up and down movement of actual daily averages. The lighter gold line depicts the general trend. This general trend was obtained by a mean filter on the blue data. Because of the nature of a mean filter, the right and left end regions are not as accurate, which you can see in the above graph. They were excised from consideration. Accordingly, the following analyses include only date values between July 1, 2009 and July 1, 2013, still a rather long time length of four years. B. Differences of the Daily Averages from the General Trend The trend filter value (gold in Figure 1) was subtracted from mean filter value for each day (blue) and the result was plotted. These differences between actual daily value and the general trend were subjected to discrete Fourier transformation. The spectrograph is below. 1. Plot of Discrete Fourier Transform of Differences The fundamental first line is the highest at 9 along the horizontal axis, and the second major peak is at 13. With these numbers, along with their heights, we can construct the major course of the data, i.e., the wave that contributes the very most to the rise and fall of daily misspelling rates in Amazon reviews. 2. Construction of the Sum of Fundamental and First Major Harmonic As you can see, before each non-Mercury retrograde time marks the local and global minima of non-dictionary word use rate with a rise to the local and global maxima all occurring in Mercury retrograde. [Edit: If you like even cleaner data and would like to see an even more perfect graph, see this more recent post, where I improve the evaluation algorithm slightly but reasonably which was enough to change the fundamental to exactly Mercury retrograde.] 5. Discussion Looking much like software’s graph of an audio clip of the human voice, Figure 2 might at first seem fascinating but opaque to easy interpretation. In the case of the audio’s graph, the sound it represents is all in there, but how do you get from the visual picture back to the sound again? After all, recording, compressing, transmitting, and recreation of audio all happen from such software. There has to be a mathematical way, and there is. One of the major tools of science of the last one hundred years is the Fourier transform. Think of someone playing a pure middle C note on a perfect piano. The Fourier transform would break down that note to a graph much like Figure 3, only there would just be a single line on the left (with its mirror on the right), also called the fundamental: the one matching the frequency of middle C. In Nature, things tend to be more complicated. An actual piano would likely have rough, very minor sub-harmonics that build on and modify the major one. The major one would still have the exact shape of the sinusoidal wave of perfect middle C, but these rough minor frequencies would adjust that first dominant curve into a final wave form that is more complicated than, but resembling, a pure C note. This set of more minor notes would also appear on the Fourier transform plot, but as shorter lines and at placements along the horizontal axis that correspond to each of their frequencies. The heights give their order of modification of the first, fundamental note. Typically, the whole wave can be summarized in just a few lines. That is how compression and removal of noise in sound happens. Returning to the sound of the human voice, the complex stacking of a rich variety of sub-harmonics could still be teased apart by the wonder of the Fourier transform, but into dozens of lines. Similarly, looking at the wave form of Figure 3, there are dominant “notes” that can be pulled out, and the most fundamental, dominant one of all, the one that all others modify, is at a frequency band of occurring approximately once every 142 to 162 days, with a phase shift for the time window of -2.90338. This is the highest band at position 9. The major, first harmonic appears next in height (and strength of effect) at the 13 position which represents a frequency band of occurring approximately once every 111 to 115 days, with a phase shift for the time window of 1.05873, the very frequency and phase shift of Mercury retrograde itself in the time period being considered. Adding the fundamental and first harmonic together, we obtain a wave, and as seen in its graph in Figure 4, the lowest troughs of the wave all happen in between the periods of time also known as Mercury retrograde with the highest peaks all in Mercury Retrograde. 6. Conclusions The results of this study are still a ways away from proving that Mercury retrograde causes spelling errors, although, with this study, an important first step has been established. Herein is just proof that the period also known as Mercury retrograde is a uniform time of maximum periodic contribution to non-dictionary word use in the dataset, an increase that can be as high as 2.19%. If this small, but significant, error rate boost in a single act would hold across a series of them, then compounded across the thousands of small things that we do each each day, it would make one virtually sure to make a big mistake (one that is built from the small steps) during the 21 - 23 days of a Mercury retrograde period. A remarkable side note is that the two percent, statistically significant increase was the same found during Mercury retrograde for a completely unrelated database’s non-dictionary use rate during a completely different period. (Oshop, Across Millions of Entries, Reddit is More Likely to Show Misspellings During Mercury Retrograde in May 2015, 2015) There may still be some unknown market or cultural factor that has exactly the same periodicity and starting point as Mercury retrograde. If so, that would still suggest a tendency, actually an absolute correlation, to increased use of non-dictionary words during Mercury retrograde seasons. People who believe in some increased danger of error during that time would still be right. The poetic turn of phrase of the harmonics of the spheres may be no mere metaphor. Works Cited Amazon.com: Online Shopping for Electronics, Apparel, Computers, Books, DVDs & more. n.d. http://www.amazon.com (accessed 10 24, 2015). "DictionaryLookup Source Information—Wolfram Language Documentation." Wolfram Language & System Documentation Center. n.d. http://reference.wolfram.com/language/note/DictionaryLookupSourceInformation.html(accessed 10 24, 2015). Discrete Fourier Transforms—Wolfram Language Documentation. n.d. http://reference.wolfram.com/language/tutorial/FourierTransforms.html (accessed 10 25, 2015). J. McAuley, R. Pandey, J. Leskovec. "Inferring networks of substitutable and complementary products." Knowledge Discovery and Data Mining, 2015. Jure Leskovec and Andrej Krevl. {SNAP Datasets}: {Stanford} Large Network Dataset Collection. June 2014. http://snap.stanford.edu/data (accessed 10 24, 2015). Oshop, Renay: - Across Millions of Entries, Reddit is More Likely to Show Misspellings During Mercury Retrograde in May 2015. 10 10, 2015. http://www.ayurastro.com/articles/across-millions-of-entries-reddit-is-more-likely-to-show-misspellings-during-mercury-retrograde-in-may-2015 (accessed 11 2, 2015). — (2015). Non-Dictionary Words Occur More Often in Amazon Reviews During Mercury Retrograde. Zenodo. DOI: 10.5281/zenodo.32847 Wolfram Research, Inc. Mathematica. Version 10.2. Champaign, IL: Wolfram Research, Inc., 2015.
1 Comment
Robin E Ferrier
12/1/2015 03:42:12 am
This really blows me away...like the paper about Twitter top celebrities did...but, in a strange way, even more so! Simply brilliant.
Reply
Your comment will be posted after it is approved.
Leave a Reply. |
ARTICLESAuthorRenay Oshop - teacher, searcher, researcher, immerser, rejoicer, enjoying the interstices between Twitter, Facebook, and journals. Categories
All
Archives
September 2023
|
© 2008–2024 Renay Oshop AyurAstro®


 RSS Feed