A Proposed Correspondence Between the Planets and the Eight Diseases of the Mind from Ayurveda9/20/2023 Chapter 1, Verse 1 of Vagbhata's "Ashtanga Hridayam" is gorgeous, often being the favorite melody of my Sanskrit students.
Devanagari Script: रागादि रोगान् सततानु सक्तान् असेष काय प्रसृतान सेशान्। औत्सुक्य मोहारति दाञ्जघान योऽपूर्व वैद्याय नमोऽस्तु तस्मै॥ IAST Transliteration: rāgādi rogān satatānu saktān aśeṣa kāya prasṛtāna seśān, autsukya mohārati dāñjaghāna yo'pūrva vaidyāya namo'stu tasmai. Translation: I offer my salutations to that ancient physician (Vaidya) who destroyed various diseases like passion (Rāga) and others, who healed countless bodies, and who eradicated the diseases of mind and others that come from it. Let's delve into the translation with some etymological elaboration: "Rāgādi Rogān": Rāgādi: "Rāga" refers to passion. The suffix "-ādi" indicates "and others" or "et cetera." Rogān: "Roga" means disease or affliction. The plural form "Rogān" refers to diseases in general. So, "Rāgādi Rogān" collectively refers to various diseases all of which stem from passions. "Satatānu saktān": Satatānu: "Satat" means constant or continuous, and "anu" means after. So, "Satatānu" implies someone who consistently follows or eradicates. Saktān: "sakta" means attached or bound. In this context, "Satatānu saktān" can be understood as "constantly eradicating passion and diseases that arise from it." "Aseṣa Kāya Prasṛtāna Seśān": Aśeṣa: "Aśeṣa" means countless or innumerable. Kāya: "Kāya" translates to bodies. Prasṛtāna: "Prasṛtāna" suggests extending or prolonging. śeśān: "śeśān" refers to remnants or remnants of afflictions. So, "Aśeṣa Kāya Prasṛtāna Seśān" signifies extending the lives of countless bodies and eliminating the remnants of afflictions. "Autsukya Mohārati Dāñjaghāna": Autsukya: "Autsukya" means eagerness or desire, like in anxiety. Moha: "Moha" represents delusion or confusion. Arati: "Arati" indicates the destroyer or vanquisher. Dāñjaghāna: "Dāñjaghāna" refers to the eradicator of afflictions. Thus, "Autsukya Mohārati Dāñjaghāna" signifies the eradication of anxiety and the destruction of delusion. "Yo'pūrva Vaidyāya Namo'stu Tasmai": Yo: "Yo" means who. Apūrva: "Apūrva" means ancient or preeminent. Vaidyāya: "Vaidya" is a physician or healer. Namo'stu: "Namo'stu" is an expression of reverence or salutation. Tasmai: "Tasmai" means to him. In summary, "Yo'pūrva Vaidyāya Namo'stu Tasmai" expresses respect and homage to that ancient physician who possesses unparalleled healing abilities (namely Dhanvantari). So, the verse essentially acknowledges and pays homage to an ancient healer who tirelessly eradicated various diseases, including those arising from attachment and desire, extended the lives of countless individuals, and dispelled afflictions like anxiety and delusion. Believe it or not, I think a lot can be said just about the first word. In Vasant Lad's translation, the eight diseases of the mind in Ayurveda can be understood to only just begin with rāga or passion. The others are kāma (lust as in The Kama Sutras), krodha (anger), lobha (greed), mada (arrogance), matsara (jealousy), dveśa (aversion or hatred), and bhaya (fear). I have a very simple proposal: that these eight problematic states of mind correspond to the eight graha (sans Ketu -- sensical because Ketu has no head; thanks, Alicia!). rāga (passion of the mind) :: Moon kāma (lust) :: Venus krodha (anger) :: Mars lobha (greed) :: Rahu mada (arrogance) :: Sun (and insanity as a whole is called unmada, meaning to rise up in arrogance, interestingly) matsara (jealousy) :: Jupiter dveśa (hatred/aversion) :: Mercury (because it comes from duality) bhaya (fear) :: Saturn It is interesting and important too that disease in general is what is eradicated by the ultimate vaidya physician and that all of them emerge from the mind (Moon). Just like we in the contemporary West speak of "crimes of passion" with the problem not actually the passion but the crimes that stem from it, so too rāga is a complex word, and the most serious of spiritual problems, namely mind-body health problems, are what arise from it.
0 Comments
Revisiting the 1985 Carlson Astrology Study: Debunking the Debunking with Modern Statistical Methods6/16/2023 Abstract Shawn Carlson's 1985 study on astrology, published in Nature, has been highly influential in critiques of astrology as a scientifically valid phenomenon. However, the closure drawn on astrology in the study, based on the lack of statistical significance in the linear regression analysis of astrologers' performance, remains questionable. In this article, we revisit Carlson's study, focusing on Figure 2 and the linear regression. Applying modern, algorithmic influence-testing using Cook Distances and DFBETAS, we examine potential outliers and reformulate the best fit line, yielding relevant rankings of 1-8, comprising 93.8% of data. The resulting regression relation (y = 0.507 + 0.0954 x) has an ANOVA p-value for the slope term of 0.0113, indicating the astrologers' actions do have a statistically significant effect. R-squared for this model is 0.684. Our findings suggest that Carlson's conclusion might not adequately consider modern statistical techniques, even as they were available to him, and further quantitative analysis of astrology may still be relevant today. Introduction In 1985, a recent Bachelor of Science graduate, Shawn Carlson, published in the premier science magazine (then or now) -- Nature -- a study of astrology! It “was prepared as an account of work sponsored by the United States Government” and was declared “… a perfectly convincing and lasting demonstration” by the journal’s editor. [1]
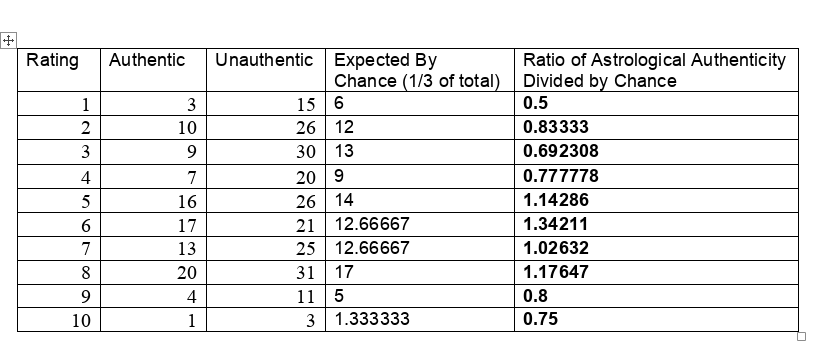
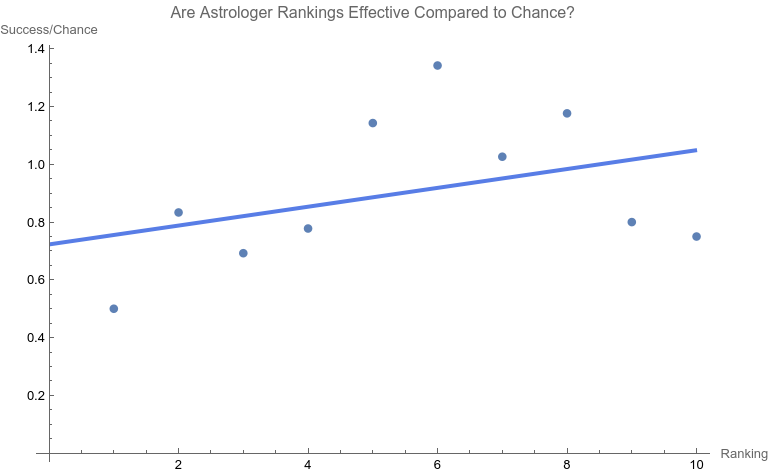
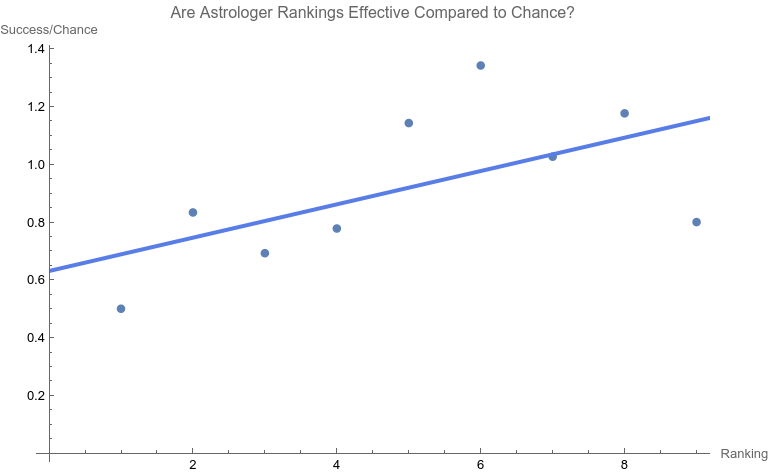
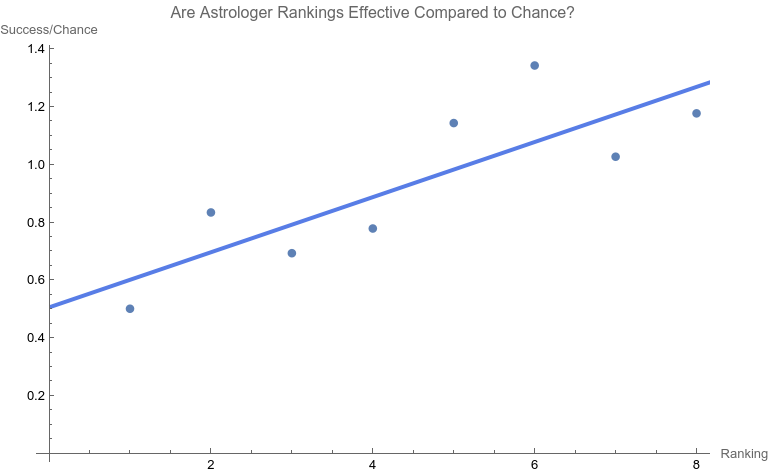
To say that the paper was and is influential would be a disservice. It is the single most effective critique of astrology in recent times. [1] Arguably the paper served the interests of debunkers and assuaged renascent throes of concern about astrology in the Euro-American general and scientific culture. Some forty years later, Carlson’s test of astrology also still influences the position of many astrologers who contend that astrology is beyond quantitative analysis and is better understood as an art than a science. [1]. While Carlson was working on the astrology study, a new statistician, R. Dennis Cook was just beginning his publication career. Cook’s contributions have proven to be prescient, protean, and vast. [2, 3] Whether you are a skeptic, debunker, or even a fan of astrology, it is important to know that Carlson’s limited study now must be said to be highly constrained by Cook’s much more far-ranging and massive work, work used in scientific crucibles of the highest capacity and resting easy on the transformative bonfires of time. A Problem There are many problems in construction, presentation, and conclusion with the Carlson study. [1] Here we will be focusing on Figure 2, the regression line. First, let’s consider the data. Consistent with the publication standards of the time, Carlson did not release the original data. However, from Figure 3 in his paper the original tabular data may be surmised. [1] They are the following. The chosen astrologers endeavored to match charts to their owners. In a sort of double-blind fashion, the astrologers were given one true chart and two false options. They were asked to rate each match from one (least certain) to ten (most certain). When the last column of data is graphed with its best fit line, a dismal picture emerges. The best fit line is y = 0.724701 +0.03262x with an ANOVA p-value of fit for the slope of the line being 0.276045. In other words, one can not claim that the slope (a measure of effect) is different from that for a flat line which has a slope of zero. That is to say, no statistical significance is found in the astrologers' actions compared to chance. Carlson relies heavily on the lack of significance in this type of regression relation in his conclusions. Is this the end of the story? Astrology is dead? Not at all. As others have brought up, there are major, legitimate, and co-existing concerns with the methodology of the study as a whole, such as:
I will focus on the particular linear regression above. The Solution Returning to one of the preeminent statisticians of our era, Cook innovated in many ways, and a preeminent one is the use of “Cook Distances” to identify highly influential points. [4] “.... Cook's distance and DFFITS are conceptually identical.... Previously when assessing a dataset before running a linear regression, the possibility of outliers would be assessed using histograms and scatterplots [Ed: as did Carlson]. Both methods of assessing data points were subjective and there was little way of knowing how much leverage each potential outlier had on the results data. This led to a variety of quantitative measures, including DFFIT, DFBETA....” [4] Influential points are not bad in themselves, but they do need to be checked for being an undue outlier. The rational and consistent way to do this in recent years is through Cook Distances and DFBETAS. [5, 6, 7] An iterative, one-case deletion algorithm is appropriate for our one-variable linear regression. [9] The approach as a whole is not too complicated in practice:
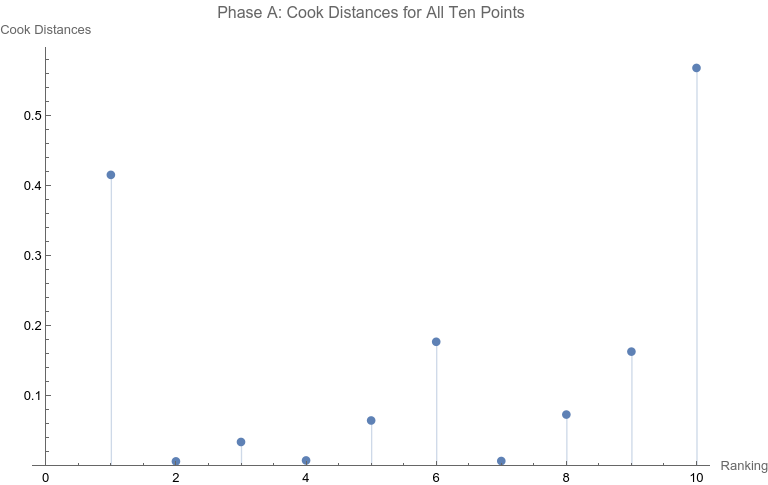
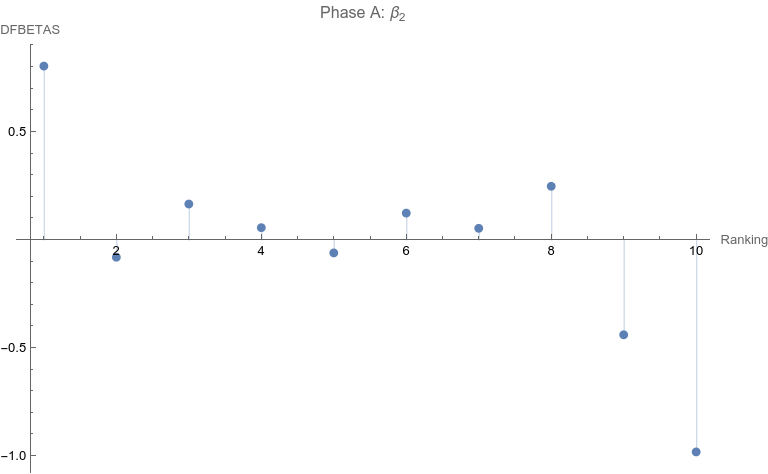
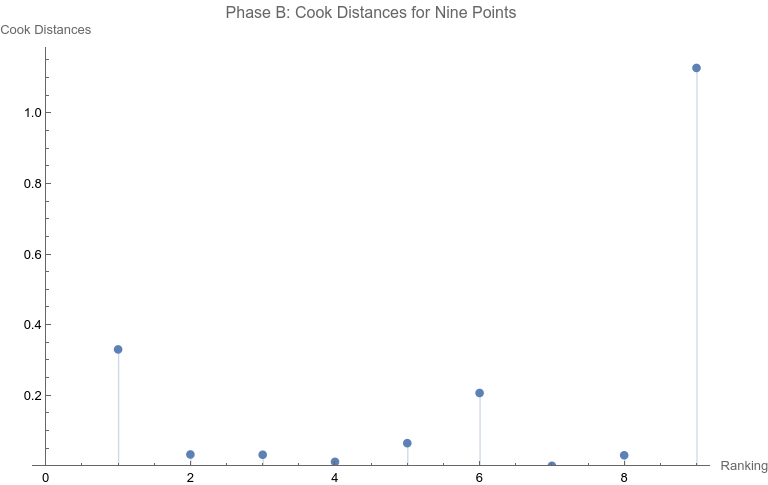
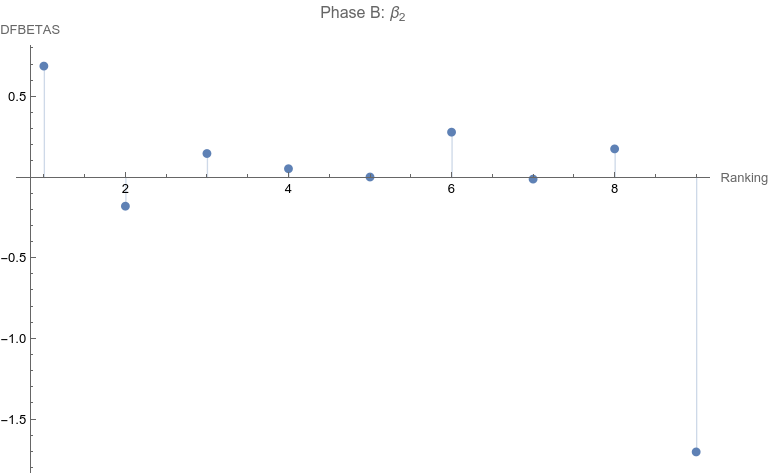
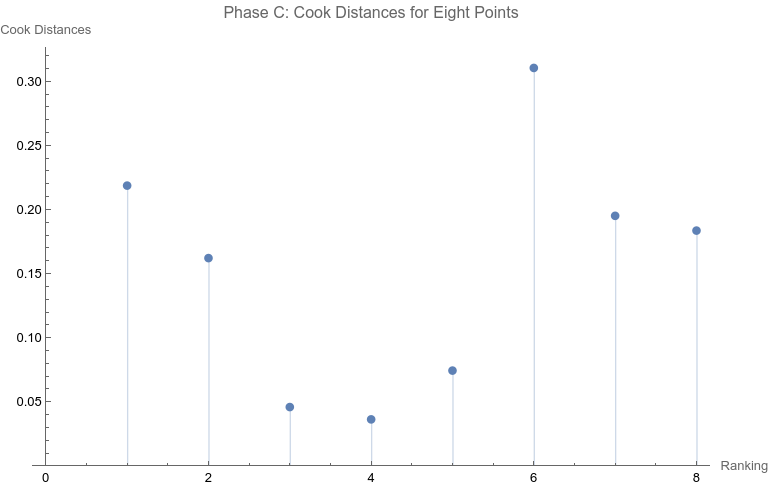
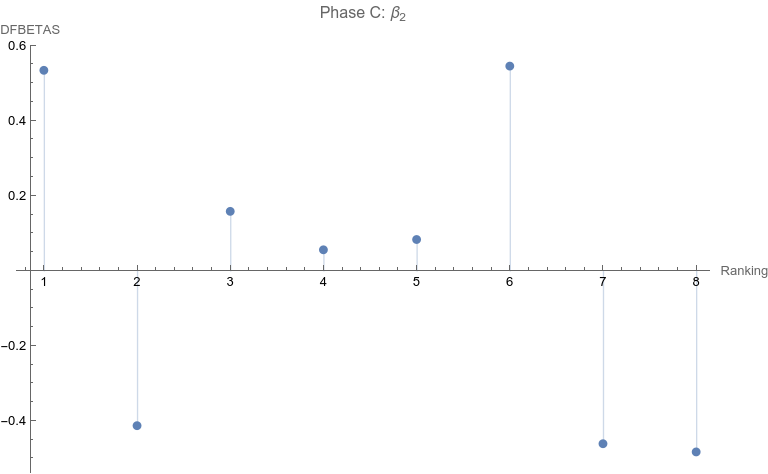
Note that none of the steps in these tests are based on p-values. Let’s apply the set of computations to the data above. Phase A: All 10 points are considered 1. The regression relation is depicted and described above. 2. The ranking of 10 is the only point that has a Cook Distance greater than the cut-off of 0.5. It is a candidate for consideration for DFBETAS for the slope. 3. 4. The cutoff for n = 10 here is 2 divided by the square root of 10 or 0.632456. The point identified from step 2 that corresponds to a ranking of 10 has an absolute value that far exceeds that cut-off. It is thus a strong candidate as an outlier influence and should be removed. Phase B: Rankings only of 1 through 9 are considered 1. The best fit linear regression is depicted. The regression relation is y = 0.632761 + 0.0576959 x with an ANOVA p-value for fit for the slope term of 0.0950004. The fit looks better already, but we have to follow the steps of the algorithm. 2. Here there is a clear outlier point at ranking of 9 whose Cook Distance far exceeds 0.5. It is a candidate for DFBETAS computation. 3. 4. The cutoff for n = 9 here is 2 divided by the square root of 9 or 0.66667. The point identified from step 2 that corresponds to a ranking of 9 has an absolute value that far exceeds that cut-off. It is thus a strong candidate as an outlier influence and should be removed. Phase C: Rankings only of 1 through 8 are considered 1 . The regression relation is y = 0.507038 + 0.0954128 x with an ANOVA p-value for fit for the slope term of 0.0112811. The fit looks way better behaved than how we started, but we still have to follow the steps of the algorithm. 2. 3. None of the Cook Distances are above the conventional cut-off of 0.5. We may conclude the algorithm. 4. For completion’s sake, the DFBETAS for rankings 1 through 8 are depicted below. None of the |DFBETAS| for the slope term are above the conventional cut-off of 2 divided by the square root of 8 or 0.70711. Conclusion We have thus found through rigorous, modern influence-testing that the best fit line is more truly: y = 0.507038 + 0.0954128 x with an ANOVA p-value for fit for the slope term of 0.0112811. The effect size may be said to be 0.0954128 per unit increase of rank. R-squared for the entirety of this final model is 0.684298 which is another measure of effect. As a bonus to applying the algorithm in this case, the cost of removing outlier influence is not dear. Only 6.17%, a small number of chart matches out of the total of 308, needs to be removed (n = 4 for the ranking of ten and n = 15 for the ranking of nine). Those two rankings also happen to be the smallest groups of the ten. Moreover, the final regression relation suggests that astrologers' sense of authenticity of the chart compared to chance is only greater than one when the ranking is at five or above. This is exactly what one would hope. The removal of the 9th and 10th rankings is not because they are inconvenient but because standard contemporary diagnostic algorithms for point sensitivity in a linear regression require us to remove them. After all, "failure to conduct post model fitting diagnostics for variance components can lead to erroneous conclusions about the fitted curve." [9] We have to gather that yes, there is effect in the astrologers’ actions, and this positive assessment is not hampered by an undue chance of it being a false positive, since the p-value of 0.0112811 is less than the conventional one-sided alpha of 0.05. Nature should retract the article. Sites Cited [1] http://www.astrology-research.net/researchlibrary/U_Turn_in_Carson_Astrology_Test.pdf [2] http://users.stat.umn.edu/~rdcook/CookPage/Bio.pdf [3] http://users.stat.umn.edu/~rdcook/CookPage/cookcv.pdf [4] https://en.wikipedia.org/wiki/DFFITS [5] https://www.bookdown.org/rwnahhas/RMPH/mlr-influence.html [6] https://data.library.virginia.edu/detecting-influential-points-in-regression-with-dfbetas/ [7] https://online.stat.psu.edu/stat462/node/173/ [8] https://independent.academia.edu/KennethMcRitchie [9] https://escholarship.org/content/qt54h3s321/qt54h3s321_noSplash_5481a8a81db5affca388b35aab6964d4.pdf Calculations:
The sky is growing dark. The streetlight and the curve of the hill we live on allow the artificial light from our township to spill down the curvature of our road, making the night seem less mature than it is. I look up at the sky - it’s a shade of dark blue-gray that comes before complete blackness. I won’t be awake for the north east suburban dark sky that would appear briefly in a few hours. I’m 7 years old. I have a bedtime. I’m standing outside on our front step, with my shoes on, because my mother’s anxiety would activate if I were barefoot outside. I know, even at this age, that my mother’s anxiety is its own justified reason to put my shoes on. I know, even at this age, that I’d rather be barefoot.
I’m in first grade and each evening this whole month of early spring, my homework is to pencil draw what the moon looks like, through each of her phases, putting the moon in little boxes on a worksheet my teacher gave me. After a few nights, my young eyes decide the boxes are too small to hold my moons. But I am without a solution, because my teachers won’t care if I tell them I don’t have what I need to adequately draw the moon - or at least that’s what it feels like. I wish they had asked me what I needed to draw the moon. I want to get closer to the moon. Even at this age, I can feel its pull and presence. This is my introduction to Jyotisha, witnessing Her limitlessness and being limited by Her simultaneously. The beginning, the middle, and the end of my knowing Jyotisha exists in my lived experiences, in the recalling of such experiences, and in the intense and immense study of experience. Her characteristics of science and fact, emphasis of time and place, Her ability to be fluid, changing, and ever course creating, Her seasonality and Her patterns all create a kind of river-like flow that is ever changing, yet predictable, and yet not. All of it is alluring, inspiring, frustrating, enticing, activating, relieving, and soothing to my mind, and my heart. I’m cold in my bones, and sort of stiff. I just slept on a Hogan floor in a sleeping bag, with multiple layers of clothing for warmth. I’m on reservation land in Navajo Nation, New Mexico on the land of a Navajo farmer, scholar, and elder. I’m here trying to understand the native Diné people. I don’t even really know my own people, but a desire rises up to know these people for whom ritual, ceremony, storytelling, fire, elements, art, and archeoastronomy are keystones. Just last night we held a ceremony in the Hogan. When it came my turn to speak, I introduced myself by way of my parents and grandparents names - for the first time ever. My dad died just two years ago. I just transferred between top tier universities, neither do I want to be at. I can't identify a place in the world that feels like home, and yet here I am in the Navajo Womb. I’m 20. Everyone in the Hogan begins to stir from their sleep. The sky is dressed in predawn stars, but what is waking all of us is the slow beat of the drum that our Navajo host is creating steadily to wake us. Tum, tum something in me knows it’s not a ceremonial sound. Not yet. Wrapped in blankets and facing east all in a straight line, our group stands outside the Hogan quietly as Larry sings in Diné language and beats his drum according to a rhythm we’ll only ever know from the experience of hearing it, but never fully understand its meaning. At this moment, we are learning by way of our hearts, rather than by way of our minds. Among the group, this is what appears to be our commonality: a curious craving for an understanding of something beyond ourselves. We turn to face all four directions, and then we hold salt in our palm, each of us told to find our own spot of earth to say our own prayer, to welcome the day, and to offer the salt in the spirit of reciprocity. The sun rises up over the mesa in a way that feels like a baptism. I’m relieved to not have to draw the sun in small square boxes. I’m glad for the vastness, and for the roundness of the Hogan. Despite the cold morning, I take my shoes off to be closer to the earth, closer in towards the sun. Here is where I begin to understand Jyotisha as my ‘Lion, the Witch, and the Wardrobe’ portal of my life. To escape into Her with each or any of my waking moments is a privilege, but also requires earning parts of the journey. Her clues. They lead me to a union of intellect and experience. Directly and indirectly. Both, at the same time. “Meditate, and then go back into the dream,” one of my teachers once relayed to me. And that is Jyotisha to me, a meditation preparing me to reenter the dream that is my life. I’m driving through the most beautiful farmland I’ve ever seen. Open lush rice fields, big skies, and animals and village life pass beyond my eyes through the window of the van. The pollution here isn’t nearly as bad as in Madurai so I have my window down and the smell of smoke, animal droppings, and food preparation fills my face all at once. I’m 25 years old. We arrive at Sri Chitraradha Perumal Temple in Kuruvithurai. This is a temple named after and in dedication to my birthstar in Jyotisha, Chitra. I just moved into a Jupiter dasha, supported by a Jupiter subdasha. My teacher tells me this is a great time to visit India again, this time as a student of Jyotish. Last time, I was a documentary filmmaker. Conveniently, as the science of Jyotisha provides, I notice there is a Jupiter temple right next to the Chitra temple. I’m so lucky to be here. My teacher has gone to the depths of research to even find the location of this temple. Our driver got lost a few times getting here from the city. But I’m here, and now I need to find yellow items for puja, and hopefully, I will still have enough time to circumambulate the temple in such a way that my teacher’s teacher advised her to instruct me to do. I think this has something to do with my birthday being just 10 days ago, but I’m not quite sure. I know enough about Jyotisha to know that when you know something, you only kind of know it, and only in the kind of way that you can know it. What might remain, you have to seek out, rely on your trusted sources, and rely in the Divine to provide. All this exchange is in a kind of equal measure that isn’t equal in the ways the mind knows equal to be. A different plane of equal, of balance. Jyotisha. During puja, inside the sanctum santorum, I’m asked to introduce myself like I did when I was in the Hogan several years prior. My parents’ names, my marriage status - these things seem to transcend what we put on them, as if we can ID ourselves in front of Spirit. But I realize, our lines matter and they need naming, not for Spirit’s sake, but for our own. I think every time I’ve introduced myself in this way, I feel the fullness of what it means to be a whole and complete person. I cry. The priest cracks the coconut as an offering to Shiva. I spend time on the temple grounds after the puja, my bare feet on the most beautiful, colorful, cool stone I’ve ever felt. Colorful stones individually placed in the cement for God. Devotion. I still have a little bit of puja ash in my palm and I fold it into a piece of paper to try and save it for later. Trying to put the puja into a little box, like I did years ago with the moon. I smile knowing that the cosmos that I’m in connection with has both a humor of irony and a subtlety of grace. Lines exist connecting all the moments of my life, and in all kinds of formations beyond that of a small box. My heart knows these jagged lines. Jyotisha is where my head meets my heart. And all I can do to prepare is to take off my shoes, literally and metaphorically, and remember that the box of my relationship with Her, is my life, and it’s actually limitless. Now approaching 30 years old, Joytisha is revealing Herself as my way of storytelling and map making. It's the time, temperature and flavor of the experiences I’m digesting in being awake to life. Jyotisha is the view from wherever I’m standing, each stance containing the past, present and future views - like Russian nesting dolls. The more time I spend unpacking the dolls, the more dolls there are. Joytisha is neverending, and my curiosity is my sustenance. She is steady, in that there is reassurance of Her force guiding, but not quite revealing fullness until, in a moment, She does. And at the same time, fullness falls apart again into an unfathomable number of completely beautiful sherds of oneself, of myself, that are actually, separately and together, also the whole of the universe. Abstract The belief in a correspondence between the planetary positions at the time of a world event and those at a similar event at another time is ancient and still claimed today (Tarnas, 2006). Using a database of 6770 dates of world events after January 1, 1600, AD from Wolfram Research, the short descriptions that accompany each date are quantified using 1536 long embeddings from OpenAI. Embeddings, a gift from machine learning, are a precise way to measure similarities between text. They were used here to quantify similarities in short descriptions without dates of pairs in 6770 world events post-1600 AD as found in a provided database. There are 22913065 unique such possible pairs. The zodiacal placements of the charts were also calculated for either the actual date at midnight of the event or the same but using the start date for a multi-day event. Only Sun, Moon, Mercury, Venus, Mars, Jupiter, Saturn, Uranus, Neptune, Pluto, North Lunar Node, and South Lunar Node Tropical degree placements from zero to 360 degrees were computed. Finding the mean of the Cosines of the differences between planetary placements for two events offers a neat and novel way of measuring similarities between these zodiacal placements for the two events. These metrics for textual similarities and chart similarities when plotted against each other suggest non-monotonic dependence with effect size between the chart extrema being 0.380. The upper p-value for independence between the two metrics is less than 0.0001 as computed by Hoeffding’s dependence measure. The conservative Monte Carlo approach to estimating the upper value of this p-value was necessary due to physical computation constraints. Thus, likelihood for the alternative to independence, namely dependence, between event textual similarities and event chart similarities is shown. A classifier for an event date being war-like or peace-like as decided by similarity of the embeddings for the event’s full description to the embeddings for the words “war” and “peace” respectively was successful as built on event zodiacal placements only. Introduction World events are often used in astrology studies. Accurate places, dates, and times are typically known even when they are not precise, allowing for a bridge between astrological placements and interpretation of social, cultural, and personal significations. Studies of the correlation between celestial positions and world events are ancient. Over six centuries during the first millennium BCE, scholars in Mesopotamia recorded nightly celestial positions and terrestrial events onto clay diaries known as menologies. So, while they might log a full moon aligned with Venus in the constellation of Taurus, they also recorded mundane events such as the price of grain, the water levels in the Euphrates River or an earthquake (Sachs 1988) (Rochberg-Halton 1991). Rarely however do these studies include enough events to achieve statistical significance for the interpretations drawn. This practice has continued into modern times. Cultural historian, Richard Tarnas documents historical evidence to support a correspondence between mundane events and astrological alignments in his book, Cosmos and Psyche (2006). The problem with verifying these claimed correlations statistically is that it is hard to measure such a diverse range of events objectively and consistently. Here I use a textual description of 6838 historical events in relation to astrological placements at the time of the event. Across many millions of pairs of events, is the size of difference in textual descriptions (which contain words loaded with social, cultural, and personal significance) related to magnitude of difference in astrological charts for the two events? I will be exploring quantitative equivalencies for most of the concepts within this question and then use appropriate mathematics to answer it. Materials and Methods Full code is available, including for the generation of event data (Oshop, 2023). Almost all of the calculations in this study were performed through the professional mathematics software, Mathematica, which offers many tools. One of those is a database of 7818 historical events (Wolfram Research, 2012). Included in the database for each event is a one sentence text-description (e.g., "Apollo 8 Returns to Earth") and the start date (e.g., December 27, 1968). Source information and metadata is not available for this database beyond assurances that it is continually being updated (Wolfram Research, 2022) (Wolfram Research, 2022). Unfortunately, this database is anglophone-centric, but alternatives are hard to come by as simple and easily accessible event databases are surprisingly rare. The data was pared down to 6838 events from 7818 by excluding dates prior to 1600 AD and all events whose start date was January 1. The first was to reduce uncertainty resulting from the switch from the Julian to the Gregorian calendar that was phased in globally from 1582 AD. The latter was to obviate a problem with the database, wherein uncertain dates for events were sometimes listed as January 1 of the year. All numbers and other specifying qualifiers were also algorithmically removed from the database event descriptions. This was to avoid an artificial connection. For example, “The Battle of 1812” could be unrelated to another event that has the year 1812 in its description. (So, “The Battle of 1812” is reduced to “battle”.) Care was also taken to ensure that there were no duplicates in the event database. Finally, removing these qualifiers in the chart descriptions to make them unspecific sometimes removed all the words in the description. Such empty event descriptions were removed from consideration, further limiting the number of events to 6770. The removal process was considered necessary to remove most artefacts of association through excessive adjectives. So, for example, “earthquake" was the desired distillate and not full descriptions of earthquakes which may have been chained together in a region in 1912. Table 1 shows the difference between the hands-off, automated distillates and original event descriptions from a random selection. Note that contemporary embeddings in general are robust enough to know when to treat names in the distillates as capitalized. For specific methods of the distilling algorithm, see the code. (Oshop, 2023)
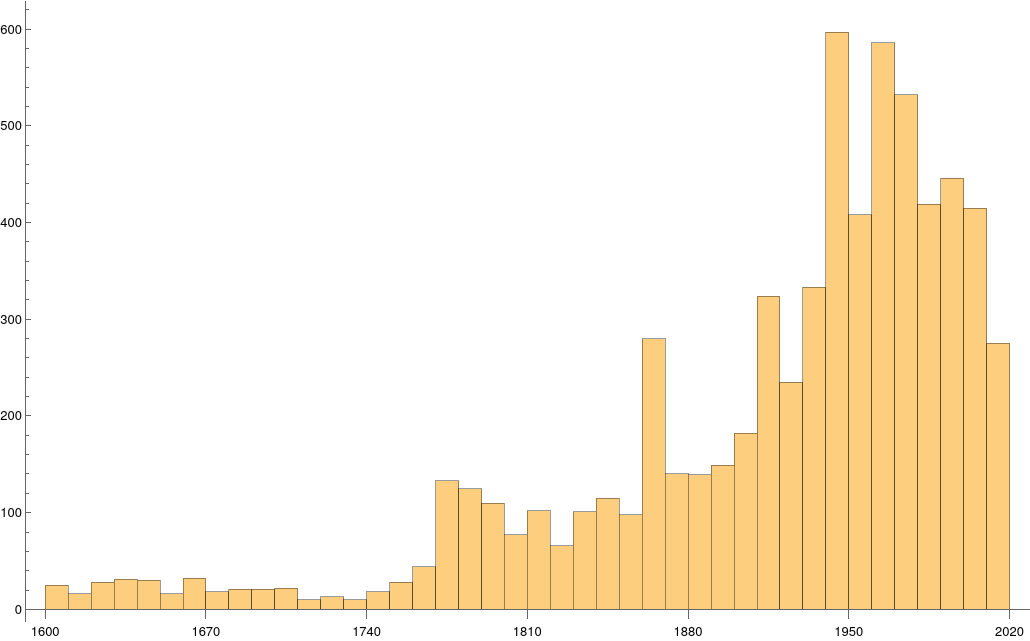
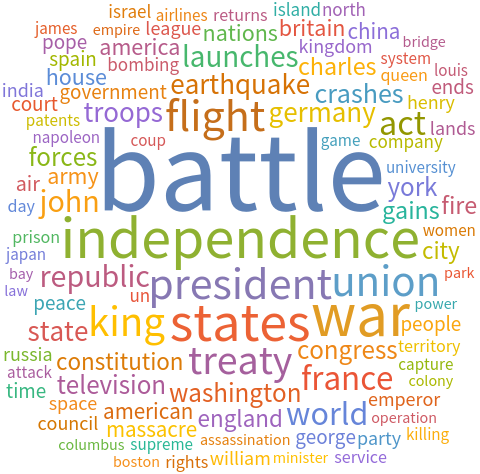
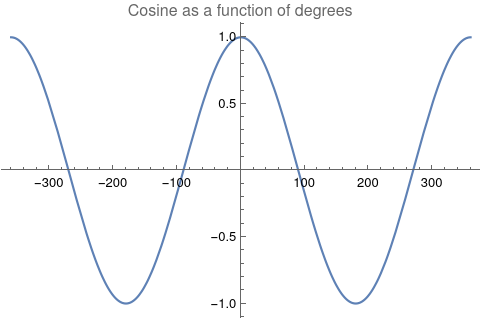
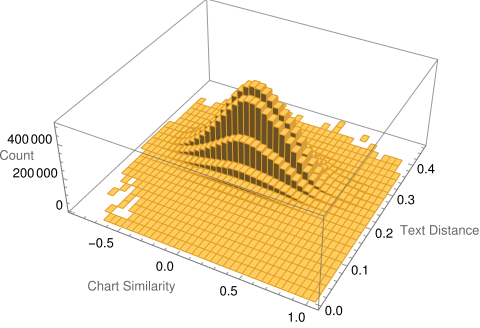
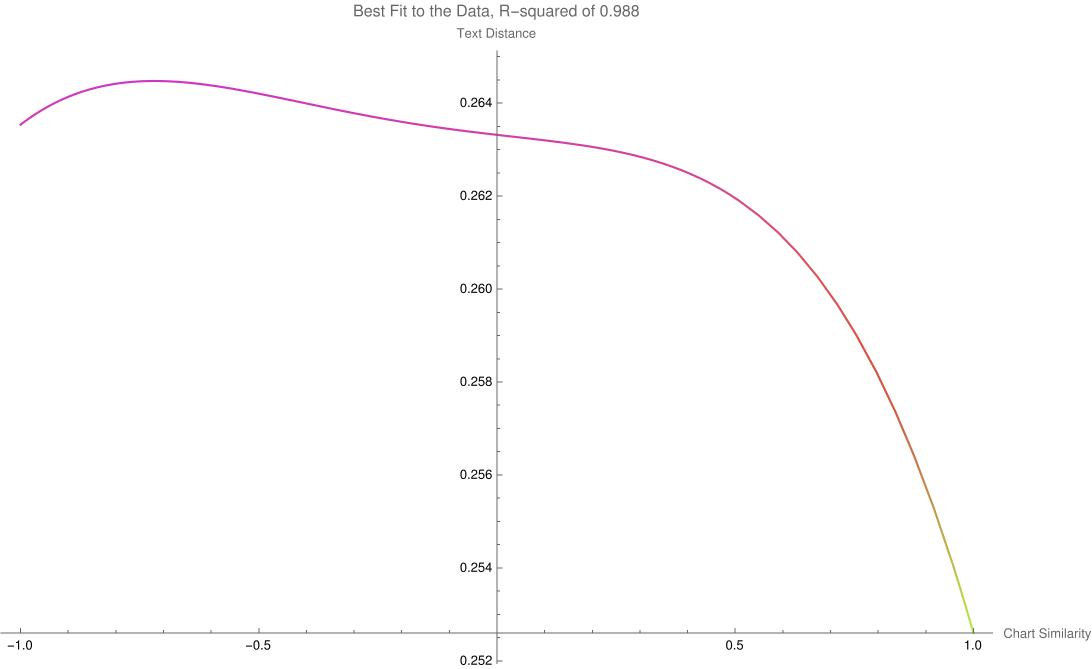
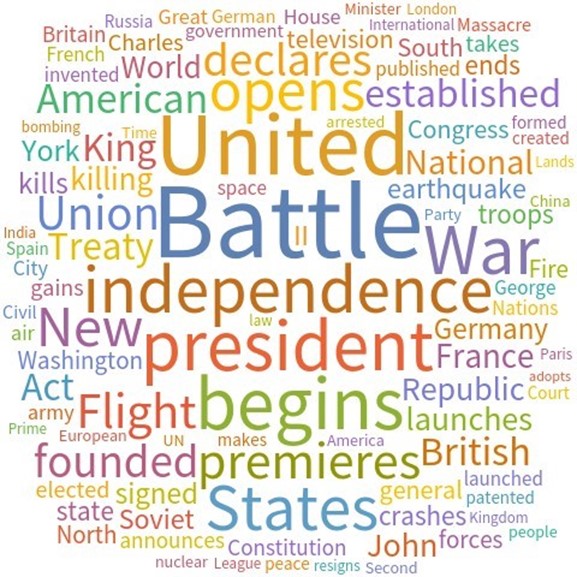
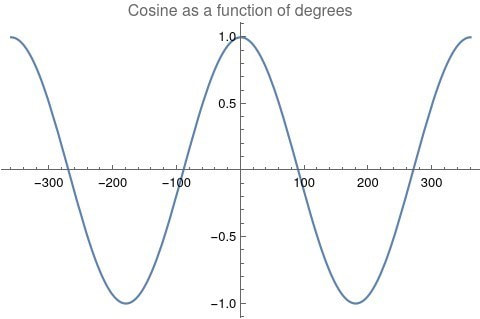
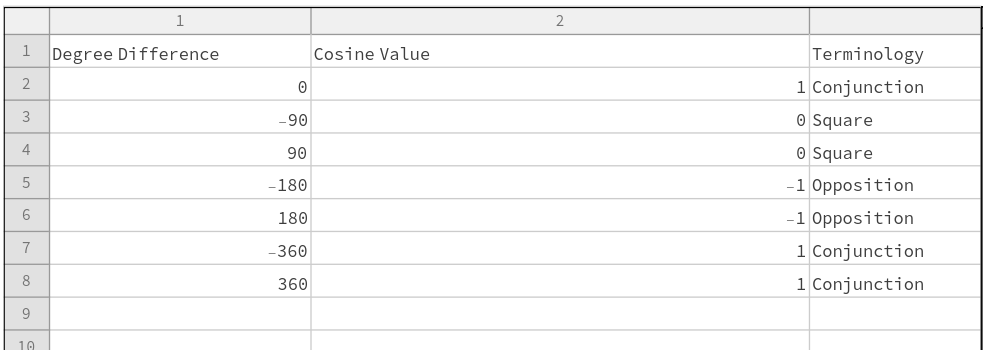
A timeline histogram of the resulting 6770 events follows in Figure 1. In Figure 2 is a word cloud of the most frequently used words in the 6770 event descriptions. Measuring Textual Description Similarities Allowing for high precision in quantitatively measuring qualitative texts, embeddings were introduced in 2003 in a paper that states that they “associate with each word in the vocabulary a distributed word feature vector … The feature vector represents different aspects of the word: each word is associated with a point in a vector space. The number of features … is much smaller than the size of the vocabulary” (Bengio, et al., 2003) (Aylien.com, 2022). These embeddings embody a literal “geometry of meaning” (Gärdenfors, 2017). To share an example from computer science literature, subtracting the embedding numbers for “man” from those for “king” and then adding those for “woman”, one gets the numbers that closely align with “queen” (MIT Technology Review, 2015). So, king - man + woman = queen. The calculator for embeddings used for this study was developed by OpenAI, was released in 2022, and uses the "text-embedding-ada-002" model. It results in a vector, a list, that is 1536 numbers long for each event’s deconstructed description. Each of the 1536 numbers in the vector is critical to fully describing the textual quality of the event description but in quantitative terms. Going from two 1536-featured vectors for each event pair to a single number is done by measuring the cosine distance between each pair’s event embeddings (Google Research, 2018). In general, as similarity between two vectors increases, cosine distance decreases. Measuring Chart Similarities The celestial positions are measured in geocentric ecliptic longitude. While this is the same metric as the Tropical Zodiac, the values are expressed between 0° and 360° from the Vernal Point or 0° Tropical Aries. For each event there are separate degrees for Sun, Moon, Mercury, Venus, Mars, Jupiter, Saturn, Uranus, Neptune, Pluto, North Lunar Node, and South Lunar Node, thus creating a 12-number-long vector for each. Reduction to a simple number was made by taking the average of the twelve cosines of the twelve angle distances for each pair. Comparing the 12-digit vectors for these zodiacal placements could be done by dot product, but that would miss some key features of astrology charts. We consider charts to be highly similar or conjunct when their degree differences, i.e., the results of their degrees’ subtractions, are either close to zero or close to 360 degrees or -360 degrees. Nicely enough, there is a trigonometric function that behaves exactly this way: the cosine. The simple plot of it follows, wherein you can see that the blue line has maxima at 0 degrees, 360 degrees, and -360 degrees. Moreover, there are other qualities of the cosine curve that preserve information from astrology. Oppositions at +/- 180 degrees yield a cosine of -1, and +/-90-degree squares yield a value of zero. These parallel the astrological interpretations wherein squares suggest no similarity, and oppositions do show similarity but of an opposite polarity as conjunctions. Degrees in between the extrema have cosine values that are appropriately in between as well.
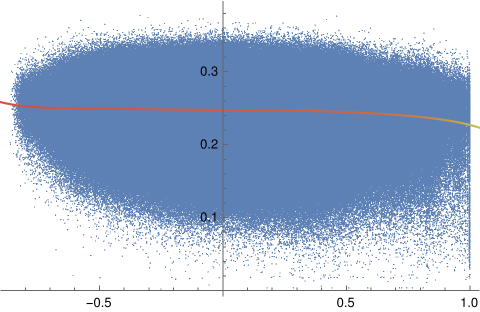
There exists a consistent bridge between astrological terminology and cosine value of degree differences between two events. Thus, for each of the two events in an event pair, the twelve placements of the second one was subtracted from those of the first one. Applying cosine to each of the twelve differences and then doing a simple average gives a single-number result that is a straightforward summary for the chart similarities of the 12 astronomy features. Measuring the Relationship Between the Texts and the Planetary Positions Next is the assignment of detecting dependence. Note that this is different than correlation. For example, a quartic is a function of the order of x raised to the fourth power. The resulting graph shows for each x one f(x), but it is not so that each f(x) only corresponds to one x. Parabolas, hyperbolas, and certain trigonometric functions such as cosine depicted above behave similarly. Thus, one can say for these that f(x) is indeed a function of x, but not in a monotonic fashion. The idea of monotonic dependence is also known as correlation, but for these special non-monotonic functions, we need to consider tests for dependence and not correlation. In short: For dependency: determine that a variable has a value that depends on the value of another variable. For correlation: the relationship between variables is linear and is considered as correlation. That is, as one similarity increases the other uniformly increases or decreases too. This paper’s study answers a question not about correlation but about the more sophisticated situation of dependence. To do the answering, a tool that can compute not just linear dependence (i.e., correlation) but also non-linear dependence, namely Hoeffding’s D (for dependence) measure, was selected. Each Hoeffding D measure test was found to take about 16 seconds to compute for 100,000 event pairs, 22 minutes for 1,000,000 event pairs, and an unknown amount for the full event pairs that number over 25 million. The latter is unknown because the computation was aborted after six days. (The computer that was used is running Linux on an AMD 3950x CPU with 64 GB DDR4 RAM.) Thus, a Monte Carlo approach was needed to estimate the upper-bound “p-hat” of the actual full p-value for independence. The approach consists of breaking up the problem into computing the p-value 10000 separate times for randomized sets that number 100000 pairs each. The equation for this conservative upper bound is simply (r + 1) divided by (n + 1), where r is the number of runs that yield a test-statistic above that which is desired (here corresponding to a p-value of alpha 0.05) and n is the number of separate times the randomization is run (here equal to 10000). All that is needed is r. Results In the Monte Carlo simulation, r = 0, yielding a p-hat upper value for p of (0+1) divided by (10000+1) which is less than 0.0001. To make it simpler to see the relationship between chart similarities to their embedding distances, here is the scatterplot of measurements in blue with their best fit line. The three-dimensional histogram edition is shown in Figure 5 wherein a subtle shift from higher counts in the upper left dropping to the lower right is seen. As the charts become more similar, description distances become smaller, and description similarities become greater. The general trend is subtle but clearer in Figure 6, wherein the nonlinear, algorithmically determined, best fit curve is shown, y=0.263316−0.00117471x+0.000483782x^2−0.00429352x^3−0.00573389x^4=0 which has an adjusted R-squared of 0.988 for fit and ANOVA p-values for coefficients that are far less than 0.0001. The relationship between the two variables is not monotonic which explains why dependence and not correlation is more proper. The effect size (Cohen’s D) in text distance when the chart similarity is one, compared to when it is minus one, is 0.380. A functional relationship between historical event text descriptions and historical event celestial placements is thus established. Successful classifier test To further test the utility of this relationship, each event description's similarity to the single-word texts of “war” and “peace” was found through cosine distance of their embeddings. Where the similarity to “war” was higher, the event’s astronomy chart set was associated with the classification of W, else the event astronomy was classified as P. Cloneable data is accessible. (Oshop, 2023) After a random 80%-20% split of data into a training set and test set, the best performing model (determined via cross-validation) was a boot-strap decision forest model. The top field importances for the model are Saturn (4.52%), Sun (4.64%), Uranus (5.12%), Pluto (10.98%), and Neptune (54.25%). Access to the interactable and cloneable model is also available (Oshop, 2023) Testing the model on the 20% test set yielded success in classifying P 95.5% of the time and W 22.9% of the time, outperforming both random choice and modal choice in recall, accuracy, precision, f-measure, and phi-coefficient. More extensive, interactable, and detailed results are available. (Oshop, 2023) Conclusions A function for similarity applied to historical event descriptions is shown to be a function of chart similarity with a p-value for independence that is far lower than 0.001. Calculating similarities between the celestial degrees on any arbitrary day and those of the nearest events in the database (even when full descriptions are not known) based on that astrology is nearly trivial. The demonstrated loose similarity of charts to these events’ descriptions may allow for some mundane event prediction. This study brings us closer to that potential future. As a demonstration of the general utility of the astronomy chart of an event holding predictive power, a classification of event astronomies into war or peace was found to have more utility than either a random 50-50 choice or choosing the more common peace classification each time. One may apply this classifier to future astronomies. As a preliminary result, it does indeed seem there is a time for war and a time for peace, as well as astronomical ways to understand a moment’s relationship to historical events that have gone before. All material for replication is included in references. (Oshop, 2023). References Aylien.com (2022) An overview of word embeddings and their connection to distributional semantic models, https://aylien.com/blog/overview-word-embeddings-history-word2vec-cbow-glove Bengio Y., Ducharme R., Vincent P., and Jauvin C. (2003) A Neural Probabilistic Language Model, Journal of Machine Learning Research, 1137–1155, https://www.jmlr.org/papers/volume3/bengio03a/bengio03a.pdf Gärdenfors P., The Geometry of Meaning (2017) MIT Press https://mitpress.mit.edu/books/geometry-meaning Google Research Inc. (2002) Measuring Similarity from Embeddings, https://developers.google.com/machine-learning/clustering/similarity/measuring-similarity MIT Technology Review (2015) King - Man + Woman = Queen: The Marvelous Mathematics of Computational Linguistics, https://www.technologyreview.com/2015/09/17/166211/king-man-woman-queen-the-marvelous-mathematics-of-computational-linguistics/ Oshop R. (2023) Is Text Similarity of Events Related to Chart Similarity? https://www.wolframcloud.com/obj/renay.oshop/Published/EventsComparisonCode.nb Oshop R. (2023) BigML Cloneable Data https://bigml.com/shared/dataset/y5gOLoQb1y9Ikkhgi9st8ASDXXd Oshop R. (2023) BigML Cloneable OptiML https://bigml.com/shared/ensemble/6AitpIkSL1tYyAEi1WCYMsZqDMi Oshop R. (2023) BigML Test Set Results https://bigml.com/shared/evaluation/9HxONbPHG3iVER1FxfgRzHMKZVS Rochberg-Halton, Francesca (1991) The Babylonian Astronomical Diaries. Journal of the American Oriental Society Vol. 111, No. 2 (Apr. - Jun.), pp.323-332 Sachs, A.J. & Hunger, H. (1988) Astronomical Diaries and Related Texts from Babylonia, Austrian Academy of Sciences, Vienna. Tarnas, Richard (2006) Cosmos and Psyche: Intimations of a New World View, New York: Viking Wolfram Research (2012) EventData, https://reference.wolfram.com/language/ref/EventData.html Wolfram Research (2022), Frequently Asked Questions, https://www.wolframalpha.com/faqs/ Wolfram Research (2022), Wolfram Knowledgebase, https://www.wolfram.com/knowledgebase/ Full paper PDF download :
New Horizons
When I told my mother about my Jyotish reading with Renay, and how it had given me peace, she told me she also had been questioning herself. What she could have done, or not done, to prevent my developing this disease. I hope my reading helped her, too. I’m fine. Really, I am very healthy and feel lucky to be alive and able to actively explore the beautiful planet we live on. I had many very dark months about four years ago, when debilitating vertigo made it difficult to walk and sometimes even to sit up. Time, yoga practice, medication, and diet tweaks have kept me vertigo-free for several years now. I am permanently nearly deaf in one ear from the episodes of fluid pressure in that ear that caused the nerve damage and led to the vertigo. But as I remind myself and others, I still have one ear left. So far, anyway. This medical condition was a contributing factor to losing out on a personal and professional dream opportunity in 2021. The loss sent me into a spiral of questions about my direction and purpose, and led me to seek out Jyotisha for insight. Why had this happened to me? What could I have done or could I do to prevent or reverse it? Although our medical establishment in the US could slap a name on what was happening and could prescribe medication to react to it, no one could tell me why it was happening to me. In some ways the inner workings of the human body remain as mysterious as other worlds. In some ways this question of “why” is something Western medicine is not equipped to address. At first it was a shock to learn from Renay that planetary alignments from my time of birth had made this dark period in my life perfectly predictable and inevitable, results of the eddies in the fluid dynamics of cosmic energy. I was born, I lived my life, I came to this bend in the river, it crashed over me. What I heard in that message was: what else would I have been able to do? The forces of nature were greater than me. What I did was I swim through that dark period, and now I get to explore the downstream opportunities. Reflecting on my reading, it has freed me from remaining mired in the sucking mud of regret. Now I can accept that whether or or not it was truly inevitable, it happened. Rather than remaining stuck in one place on on one version of a dream, my reading suggested new destinations that inspire me to work my way towards them. Redefining my horizons by moving past one dream has not meant limiting those horizons, but actually expanding them. In the year since my visit to Renay, my horizons have expanded as I began a new job that has challenged me to learn entire new fields of science and business. Moreover that new position has given me the financial and temporal freedom to learn to literally fly, another longtime dream. Surfing the currents of the wind on a paraglider physically expands your Earthly horizons, with the wind in your face and the birds below and beside you, connecting you to the essential air element of our beautiful planet without doing harm through burning jet fuel, and growing your mind and body to move in three dimensions at once. Perhaps if the insight from one Jyotish reading can expand my horizons this much, further insight from study and consultations can do even more. Or perhaps not. In everything, I am learning (and relearning and relearning) there is a balance, and there may be elements of my charts I wish not to know. But if nothing else, it is a new way of perceiving the world that may expand not just my external, but my internal, horizons. We Are Made of Stars Perhaps it started when I was 22. I had a roommate in college who studied Western Astrology and taught me all of the energies of the planets, and the signs, and those 12 houses. We would sit in front of our wood-burning fireplace, and open books and read-aloud to each other from her traditional Western Astrology texts. One of those books was about the wisdom of Jupiter, and how his placements in our chart show us where we are lucky. I was lucky, I thought. I knew enough to identify someone’s Jupiter, and then I could tell my friends about this juicy planet in the sky that brings us bounty and good fortune. That alone made me a bit of an astrologer; it gave me a kind of identity. I thought. Perhaps it was that same year, and the night I wrote these words alone on a single page of my journal: “We are made of stars.” I was staring up at a clear night sky from the balcony of my Boulder Colorado apartment, watching the full moon very close to Jupiter, the pair like a slow dance. That vibrant light and exuberant energy could be felt. It tingled. I remember a little dance on my insides. Perhaps, it was sitting, wrapped in a blanket, on that patio for hours just staring into that bright light face, and letting that energy wrap me tighter. I began to realize astrology was real. These planets lived above me, around me, and also inside of me. Perhaps it started when I randomly met my Vedic Astrology teacher at a pool party, and I asked her the same question I asked everyone I met at that time, “What’s your sign?” It was like a party trick that always worked. It was Boulder. When you tell someone about herself, see someone in a way that they don’t see themselves, it’s usually a win. I was learning. She immediately told me her ascendant, her moon and sun sign, and I knew I had a new friend. Little did I know that friendship would turn into a relationship of great importance to my spiritual development and unfolding for the rest of my life. She was a Vedic Astrologer, and in the way I understood the “light” of Western Astrology, she understood more, something more true. She also knew more about me than I knew about my own chart, and she hadn’t yet looked at my chart. I told her I was a Virgo rising. “Your hair has shades of red,” she pointed out with a kind of uncanny certainty, “maybe you're a Leo.” I am a Leo ascendant in the Sidereal Zodiac. That wisdom became a source of light for me; I needed to know more. No matter how many astrology readings I had, there was something I was not getting. A relationship was, yet again, not working out. My heart continued to break again and again. Each time, I scheduled another Vedic Astrology reading. Somehow I thought if I understood the planets and memorized everything happening in the transits, dosha periods, and varshphals, then I could somehow control the outcomes of my life. I could be ready for everything that would happen. I could make my heart okay. One astrologer once said, “I’ve never met someone so obsessed with their chart.” I needed my chart to define me. But the truth was, knowing more about astrology wasn’t saving me, but it was bringing me closer to a kind of inner knowing. Just like my yoga practice, I needed my chart to understand my body and my mind – I was unconsciously seeking balance. As I worked to breathe and perfect the alignment of poses, I needed my chart to see patterns of my life. Once in a while, while finding that alignment, grace would flood my heart, and I came to realize that through breath and in practice we come closer to God. I needed my chart to show me how I experience life. It was all a thing on screen, and on a page, and I could observe how my life is unfolding and may unfold. We call our charts the play of our lives, and I become an actress on a stage performance orchestrated by the planets and their relationships. It is all a thing I was doing. This inner drive made me a student of Vedic Astrology. I began feeling sparks of the light of the universe in yoga poses and meditation, like tiny hits of truth within. The light I was grasping for was apparent inside of me. It was not separated from me. I was not separated from it. It was in giving myself a sense of “personality,” I was separating myself; by needing consistent definition and approval, I was less aligned. I wasn’t the definitions of those planets. I am the planets. All I wanted to do was find more of that light. I started acquiring a new understanding of the universe as I studied Vedic Astrology texts, The Bible, The Bhagavad Gita, Ram Dass, Neem Karoli Baba, various forms of meditation, and deepening my yoga practices. I learned that nothing is better or worse, no chart is better or worse, no dosha period is better or worse. The source of all light is one single source. My meditation practices deepened most of all, and a powerful flow of grace started to become my life – I felt it in my work, on my walks, in each step. There wasn’t anything separating me from God. All I had to do was surrender to the divine flow, the plan in front of me, this single moment, and the source of love would fall into me. Jyotisha is an invitation to a path that allows us to find our way to God. Light. The study of light. God is light. And it still is, sitting on a patio somewhere, staring at the face of the moon and feeling the completeness within; the infinite stillness of the perfection of the universe resides within me. Everything I’ve ever desired is within this very moment. Within this very breath. In fact, that moment, almost 20 years ago, isn't different from the ones I experience now. Only now, that light is more consistent, it’s more often, it’s assimilating. Each of those heavenly lights in the pure night sky, a continuum and a perfection, dissolving in and out of one singular one. This connection, a web of hearts. We are made of stars. One giant beating pulse of light. God. We three judges had such a difficult time determining the winners of the holiday essay contest, but here they are: First prize goes to 8044918919, second prize to NewHorizons, third prize to gxx6fm7gfc. Please reach out to claim your prize by following the instruction below. I am so pleased to share that there is a second holiday essay contest at AyurAstro.com going on now.
The theme is "What Jyotisha Means to Me." The first prize is $500, the second prize is $250, and the third prize is $100. The deadline for submission is Dec 31 at 12 am Mountain time. You may submit your essay at https://www.dropbox.com/request/kIFmqMUw8VX1T2KcNeTt You must be over 18 years of age and a client or student at AyurAstro.com as of Dec 18, 2022. If you win, others will see your anonymous work, and you will receive a cash prize. Who is eligible: students and clients of Renay who are 18 years of age or older as of December 18, 2022 and who have had a class or appointment with Renay between January 1, 2017 and December 18, 2022. Prizes: One first prize: $500. One second prize: $250 One third prize: $100. All winning entries will be posted anonymously on this website: AyurAstro.com. By entering, you agree to this posting of your work. (Of course, you may publish the essay yourself also!) How to enter: Write an essay of between 250 and 2500 words on the topic of what Jyotisha means to you. The essay can be submitted in .docx, .rtf, .odt, or .pdf format. Choose a ten digit or longer self-defined alphanumeric code. Use your code as the file name of the essay and put it at the top of your essay. Do not put your name or email or other identifying information in the file. The submission should contain just your code, the text of your essay, and the following line at the bottom: "I hereby permit the use of my essay for anonymous, non-exclusive publication on AyurAstro.com." (All copyrights shall remain with the entrant/author.) Submit it using this link here before the deadline of 12 am Mountain (USA) time early in the day of December 31, 2022. No submissions will be accepted at or after that time. Use your code as the file name of the essay. By entering this contest, you agree to the following: Neither AyurAstro.com nor Renay Oshop are responsible or liable for any computer or internet malfunctions leading to a late entry. No compensation will be awarded to anyone for disqualification, late entry for any reason, or failure to win a prize. Essays will be judged by a team consisting of Renay Oshop and two advisers. Final decisions will be made by the team, and no objections or negotiations will be considered. Anyone who fails to comply with all contest rules will be disqualified. Relatives and non-client or non-student friends of Renay Oshop are not eligible to enter or win. Winning criteria: the winner will be chosen using subjective criteria of readability, aesthetics, and evocation of the grace of Jyotisha. How a winner will be announced: Renay will announce the winners by publishing at the top of this page as well as in social media on December 31, 2022 just the winning codes. You can then claim a winning entry by contacting Renay with your code, your mailing address, and the first paragraph of your essay. Renay will then verify that you have had an appointment or class with her between January 1, 2017 and December 18, 2022, and that your age is over 18. Money orders to the winners in the appropriate amount will then be mailed on January 2, 2023. Happy holidays! Nakshatras are a beautiful part of jyotish and are believed to be the first, early, and progenitor features of understanding the sky. Meaning "worshipped stars" and other things, they are smaller slivers of the sky than the constellations and contain potent mythology that holds true even in the everyday "real life". Let me give you two examples.
A friend has the lord of the tenth house of career, Venus, exalted in the third house of use of hands, but that is not all. The placement is in a smaller subset of degrees, a nakshatra, associated with woodworking. Sure enough, he has the unusual contemporary profession of being an ancient-style wood worker. Another example is a client who has a very strong Jupiter in Revati (a nakshatra holding meaning of shepherding and timepieces as well as other things) as indicator for work colleagues. She works with people who shepherd subatomic particles and maintain the timings for the very massive machine doing the splitting. It is so cool to see these ancient indications expressed in very modern terms. These mythically rich lanscapes of the zodiac hold many secrets, including, I feel, information about types and styles of healers! ASHWINI the miracle worker KRITTIKA the brilliant, incisive cook PUSHYA the enveloping, nutrifying, nourishing mother ASHLESHA the shakti-filled nurse VIRGO (all 3 nakshatras) the thoracic specialist; the Hippocrates-style hygeinic, pure-minded and earnest doctor; the bodywork specialist ANURADHA the mathematician SHATABHISHAK the brilliant herbalism or pharmaceutically informed wizard who can heal difficult, mysterious illnesses as if one were "100 physicians" (the translation of the name) UTTARA BHADRAPADA the monk REVATI the shepherd Does your chart show signs of being one of these types of healers? Let us know, and feel free to ask if you would like your chart looked at for this purpose!
Early narrative explaining results as of May 13, 2022 (presentation for OPA Research):
The slide set:
Whiteboard explainer video:
Download the Powerpoint slide set which includes the video:
The below is automated daily data cultivation with automated daily aggregate analysis in Wolfram Mathematica:
To download or use a copy of the code immediately above, click on the three lines in the bottom left and then choose "make your own copy" or "download". There is a free time-limited version of Mathematica that you can use with the download, or making your own copy will open up an online version of the software that you can use for free.
Finally, use the below to cultivate the daily asteroid namesake article counts:
Python code for cultivation of daily data
import requests from bs4 import BeautifulSoup import pandas as pd from datetime import date from datetime import timedelta #import numpy as np #dataset containing 1200 names df = pd.read_csv('names to search Fiverr A.csv') #creating a list of all 1200 names all_names = df['NAME'].values #input_date = '2022-02-16' input_date0 = date.today()-timedelta(days =1)#gives yesterday date input_date = input_date0.isoformat() #print(input_date) #input_date = input('Enter the date in format yyyy-mm-dd example 2022-02-03: ') #Generating Urls from given list of names def get_url(name): url_template = 'https://news.google.com/search?q={}' url = url_template.format(name) return url #Scraping news title and date def get_news(article,name): #title = article.h3.text title_date = article.div.div.time.get('datetime').split('T')[0] # print(title_date) if title_date == input_date: all_data = (title_date,name) return all_data #Main function to run all code main_list = [] def Main_task(): for news_name in all_names: records = [] count = 0 url = get_url(news_name) response = requests.get(url) soup = BeautifulSoup(response.text,'html.parser') articles = soup.find_all('article','redacted') for article in articles: try: all_data = get_news(article,news_name) records.append(all_data) except: continue count = len(records) # print("---") main_list.append((news_name,count)) Main_task() mynamedata = pd.DataFrame(main_list,columns= ['NAMES',input_date]) mynamedata.to_csv(input_date+'.csv') Abstract Embeddings, a way to measure similarities between texts, are a recent gift of machine learning. They were used here to quantify similarities in very short descriptions without dates of pairs in 7153 world events post-1600 AD as found in a provided database. There are 25,579,128 unique such possible pairs. The zodiacal placements of the charts were also calculated for either the actual date at midnight of the event or the same but using the start date for a multi-day event. Only Sun, Moon, Mercury, Venus, Mars, Jupiter, Saturn, Uranus, Neptune, Pluto, North Lunar Node, and South Lunar Node Tropical degree placements from zero to 360 degrees were computed. Adding up the Cosines of the differences between planetary placements for two events offers a neat and novel way of measuring similarities between these zodiacal placements for the two events. Thus, I have metrics for textual similarities and chart similarities. The imagery of these metrics plotted against each other suggests non-monotonic dependence. This study answers a precise question: what is the p-value for independence between the two metrics? The upper p-value for independence is less than 0.01 as computed by Hoeffding’s dependence measure. The conservative Monte Carlo approach to estimating the upper value of this p-value was necessary due to physical computation constraints. Thus, likelihood for the alternative to independence, namely dependence, between event textual similarities and event chart similarities is established. A separate Hoeffding's dependence measure for each celestial feature is calculated for the special case of event distances to the word "Battle". A Monte Carlo simulation shows that these separate Hoeffding's D measures are mostly extremely unlikely given the distributions of celestial degrees in the data. Wolfram language code and data are included. Introduction World events are often used in astrology studies. Accurate place, date, and time are typically known even when they are not precise, allowing for a bridge between astrological placements and interpretation of social, cultural, and personal significations. Rarely however do these studies include enough events to achieve statistical significance for the interpretations drawn. Instead, I posit a more general and more foundational hypothesis: across many millions of pairs of events, is the magnitude of difference in textual descriptions (which contain words loaded with social, cultural, and personal significance) related to magnitude of difference in astrological charts for the two events? I will be exploring quantitative equivalencies for most of the concepts within this question and then use appropriate mathematics to answer it. Materials and Methods All of the calculations in this study were performed through the professional mathematics software, Mathematica, which offers many tools, one of which is a database of 7818 historical events.[1] Included in the database is a one sentence text-description (eg "Apollo 8 Returns to Earth") and start date (eg Dec 27 1968). Source information and metadata is not available for this database beyond assurances that it is continually being updated.[2][3] Unfortunately, this database is largely anglophone-centric, but alternatives are hard to come by as more general event databases are surprisingly hard to access. The first step to cultivating the data was the choice to include only events that took place at and after the year 1600 AD. The reasoning is that there was a calendrical revolution with the introduction of the Gregorian system around year 1582 with delays in adoption in some cultures that took many years. This restriction of date pares the 7818 events down to 7153 events. A timeline plot of the events follows. Next, I removed all numbers in the database event descriptions, because I do not want to connect similarity between eg “The Battle of 1812” and another event that may have the year 1812 in its description. (So, “The Battle of 1812” is reduced to “The Battle of”.) To not do this would allow de facto some correspondence of text description and chart placements which I want to avoid. Care was also taken to assure that there were no duplicates in the event database. A word cloud of the most common words in the resultant event descriptions follows.
For pair construction, 7153 options are available for the first event and 7152 are available for the second event. Multiplying these and dividing by two to erase repetition yields 25,579,128 possible unique pairs. The following analysis is applied to each pair.
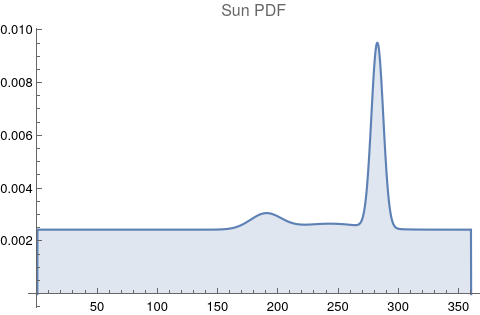
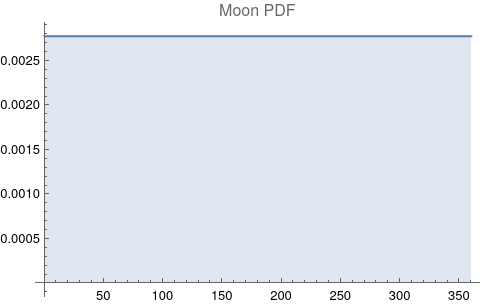
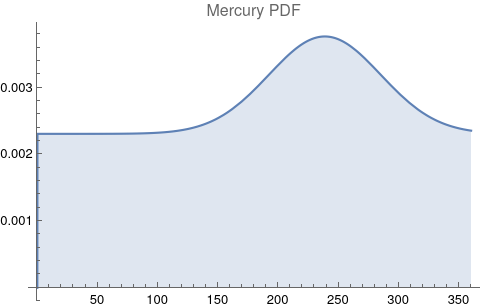
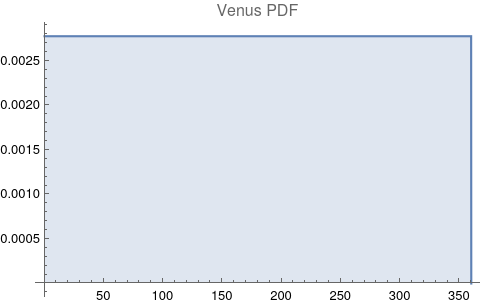
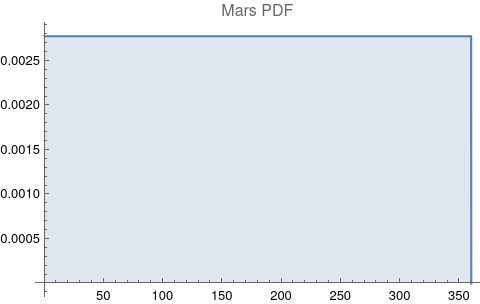
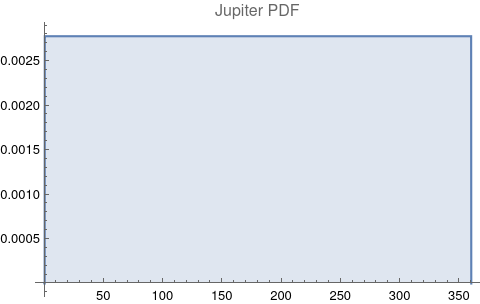
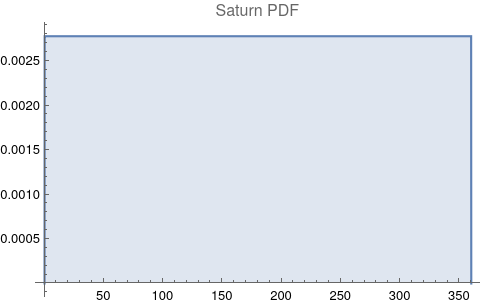
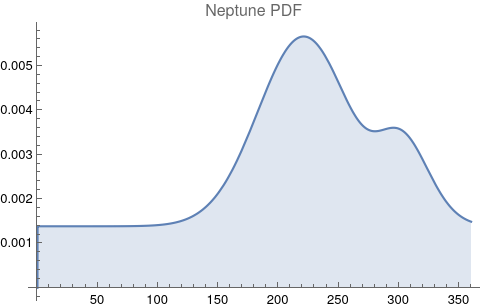
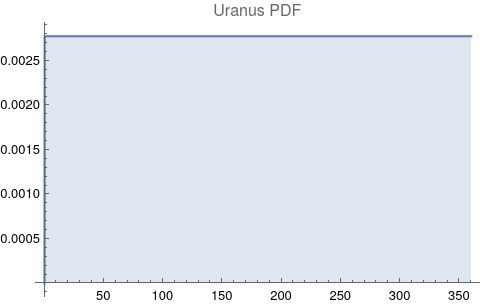
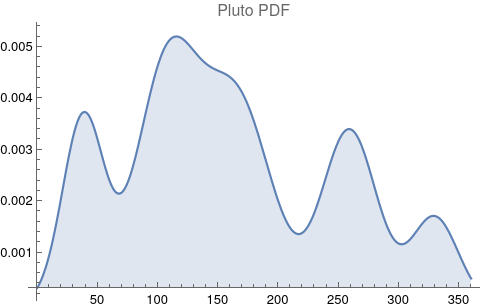
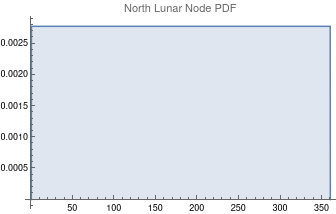
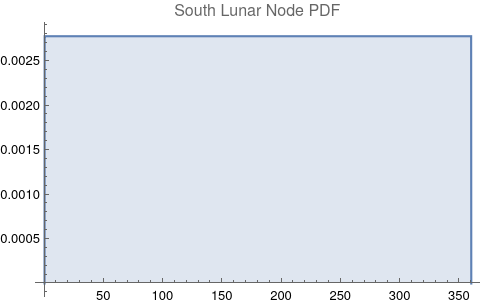
The questions for each pair are: a. “How exactly similar are their textual descriptions?”, b. “How exactly similar are their planetary placements?”, and c. “Do these two similarities correspond to each other?” For a. only since early 2000’s AD is there a way to more precisely measure this trait of qualitative texts. Embeddings were introduced in 2003 in a paper that states that they “associate with each word in the vocabulary a distributed word feature vector … The feature vector represents different aspects of the word: each word is associated with a point in a vector space. The number of features … is much smaller than the size of the vocabulary”.[4][5] These embeddings embody a literal “geometry of meaning”.[6] To share an example from popular computer science literature, subtracting the embedding numbers for "man" from those for "king" and then adding those for "woman", one gets the numbers that closely align with "queen".[7] So, king - man + woman = queen. The particular calculator for embeddings used for this study was developed by Google Research, Inc., was released in 2018, and is called Bidirectional Encoder Representations from Transformers (BERT).[8] It results in a vector, a list, that is 768 numbers long for each event description. The similarity metric between two event descriptions is simply the dot product of their 768-number-long vectors.[9] Decapitalization did not affect the calculations. Next is the assignment b. to compare the Tropical zodiac placements for the dates of each event pair and have a similarity measure. These geocentric ecliptic longitude placements are values between 0 degrees and 360 degrees and are also the degree placements used in Tropical astrology. For each event there are separate degrees for Sun, Moon, Mercury, Venus, Mars, Jupiter, Saturn, Uranus, Neptune, Pluto, North Lunar Node, and South Lunar Node, thus creating a 12-number-long vector for each. Descriptive plots for the probability distribution function (PDF) of each celestial feature as a function of degrees follow.
There are obvious spikes for some of these features. Perhaps the dramatic increase in the high 200's for the Sun degrees is most surprising. (There may be more public news events in the northern hemisphere's late autumn and early winter when the Sun would be yearly at these degrees. For example, events around the USA Thanksgiving and Christmas holidays may register more as news-worthy.)
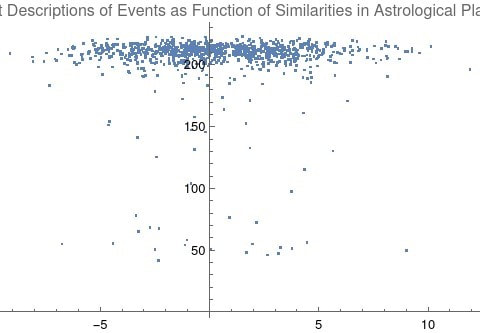
Comparing the 12-digit vectors for these zodiacal placements could be done by dot product too, but that would miss some very important features of astrology charts. We consider charts to be similar or conjunct when their degree differences, ie the results of their degrees’ subtractions, are either close to zero or close to 360 degrees or -360 degrees. Nicely enough, there is a trigonometric function that behaves exactly this way: the cosine. The simple plot of it follows, wherein you can see that the blue line has maxima at 0 degrees, 360 degrees, and -360 degrees. Moreover there are other qualities of the cosine curve that preserve information from astrology. Oppositions at +/- 180 degrees are at -1, and +/-90 degree squares hold a value of zero. These parallel astrological interpretation wherein squares suggest no similarity, and oppositions do show similarity but of an opposite polarity as conjunctions. Degrees in between the extrema have cosine values that are appropriately in between as well. Thus for each of the two events in an event pair, the twelve placements of the second one was subtracted from those of the first one. Applying cosine to each of the twelve differences and then doing a simple summation gives a single-number result that is a straightforward but robust metric for the 12-planet chart similarities. Next is c., the assignment of detecting dependence. Note that this is different than correlation. For example, a quartic is a function of the order of x raised to the fourth power. The resulting graph shows for each x one f(x), but it is not so that each f(x) only corresponds to one x. Parabolas, hyperbolas, and certain trigonometric functions such as cosine depicted above behave similarly. Thus, one can say for these that f(x) is indeed a function of x, but not in a monotonic fashion. The idea of monotonic dependence is also known as correlation, but for these special non-monotonic functions, we need to consider tests for dependence and not correlation. In short: For dependency: determine that a variable has a value that depends on the value of another variable. For correlation: the relationship between variables is linear and is considered as correlation. That is, as one similarity increases the other uniformly increases or decreases too. This paper’s study answers a question not about correlation but about the more sophisticated situation of dependence. To do the answering, I wanted a tool that can compute not just linear dependence (ie correlation) but also non-linear dependence.[10] Hoeffding’s D (for dependence) measure was selected. Each Hoeffding D measure test was found to take about 16 seconds to compute for 100,000 event pairs, 22 minutes for 1,000,000 event pairs, and an unknown amount for the full event pairs that number over 25 million. The latter is unknown because the computation was aborted after six days. (The computer that was used is running Linux on an AMD 3950x CPU with 64 GB DDR4 RAM.) Thus, a Monte Carlo approach was needed in order to estimate the upper-bound “p-hat” of the actual full p-value for independence. The approach consists of breaking up the problem into computing the p-value 100 different times for randomized sets that number 1 million pairs each. The equation for this conservative upper bound is simply (r + 1)/(n + 1), where r is the number of runs that yield a test-statistic above that which is desired (here corresponding to a p-value of 0.05) and n is the number of different times the randomization is run (here equal to 100).[11] All that is needed is r. Results The computations of n = 100 randomized runs resulted in an r value of 0. Therefore, the p-value upper bound, also known as p-hat, is: (0 + 1)/(100 + 1) or 0.0099 < 0.01**. In fact, for every one of the 100 runs of 1 million randomly selected pairs, the computed p-value was smaller than the smallest number the software can handle, 6^-1355718576299610, and for each of those 100 runs, a plot of event pair description similarities as a function of chart similarities was made. The following is a movie of the 100 plots in sequence. Note the boundaries at x = +12, x = -12, y = 0, and y = around 250. These correspond to extremely similar charts, extremely dissimilar charts, dissimilar text descriptions, and similar text descriptions respectively.
To make it somewhat simpler to see the relationship, here is an example picture with just 1000 random pairs to show a general shape.
A likely dependent relationship between similarities in historical event text descriptions and similarities in historical event chart placements is thus established.
Example Case of Looking at a Specific Word, "Battle" Calculating Hoeffding's dependence between each individual celestial feature and the 7153 distances to any given keyword is computationally tractable, even while computing across all keywords is not. The following is a demonstration using the most frequent keyword in the event descriptions, "Battle".
To see how likely the resulting dependence measures are, a second, more specific Monte Carlo simulation of 10000 sets with 7153 randomized charts in each set was used to calculate p-values. The randomizations were distributed according to the PDFs of each celestial feature.
Celestial Feature Hoeffding's D Monte Carlo P-value Sun 0.015 << 0.00001 Moon 0.62 << 0.00001 Mercury 0.006 << 0.00001 Venus 0.013 << 0.00001 Mars 0.042 << 0.00001 Jupiter 0.15 << 0.00001 Saturn 0.068 << 0.00001 Neptune 0.47 << 0.00001 Uranus 0.01 << 0.00001 Pluto 0.13 << 0.00001 North Lunar Node 0.00 0.47 South Lunar Node 0.00 0.26
Conclusions
In this paper, similarities in historical event descriptions are shown to be most likely a function of chart similarities with an estimated p-value upper limit for independence that is under 0.01. A relationship between astrological chart similarities and event description similarities seems to exist. This relationship could well be employed to allow for event prediction based on a future day's projected geocentric astronomical placements. Correspondence and not correlation was the focus as it appears in list plots that the state of textual similarities vary as a function of chart similarity. There are some interesting connections to make from the plots of the two similarities. First, there is some imperfect symmetry across the y-axis, saying that very large positive-number chart similarities (indicating all close conjunctions) can behave somewhat like very large negative-number similarities. The latter would occur when the twelve degree differences are all close to 180 degrees, ie when there are strong oppositions. That too is considered a strength between two charts, so this may be some empirical support for that belief in astrology. In the example of pinning event description distance to the keyword "battle", the dependence measures of the nodes are not statistically significant, but everything else is. Moon and Neptune exhibit greatest dependence measures for "battle" which is astrologically surprising. Some readers may be concerned that Neptune's dependence measure is high in that example, because it moves so slowly and hence may be associated with an era in time, ie an era with more battles. That is where the second Monte Carlo significance comes in very handy. It tells us that, given the probability distribution for Neptune, the natural occurrence of such a high dependency measure is extremely unlikely. As well, note that Uranus and Pluto do not show high dependence measures in this case, even though they move as slow or even slower than Neptune. Moreover, the pre-eminence of the very quick-moving Moon and its uniform PDF negate the concern altogether. Code is available, including for the generation of data.[12] Works in Progress To continue this study, work on the following has commenced.
References 1: Wolfram Research, EventData, 2012, https://reference.wolfram.com/language/ref/EventData.html 2: Wolfram Research, Wolfram Knowledgebase, 2022, https://www.wolfram.com/knowledgebase/ 3: Wolfram Research, Frequently Asked Questions, 2022, https://www.wolframalpha.com/faqs/ 4: Bengio Y., Ducharme R., Vincent P., and Jauvin C., A Neural Probabilistic Language Model, 2003, Journal of Machine Learning Research, 1137–1155, https://www.jmlr.org/papers/volume3/bengio03a/bengio03a.pdf 5: Aylien.com, An overview of word embeddings and their connection to distributional semantic models, 2022, https://aylien.com/blog/overview-word-embeddings-history-word2vec-cbow-glove 6: Gärdenfors P., The Geometry of Meaning, 2017, MIT Press, https://mitpress.mit.edu/books/geometry-meaning 7: MIT Technology Review, King - Man + Woman = Queen: The Marvelous Mathematics of Computational Linguistics, 2015, https://www.technologyreview.com/2015/09/17/166211/king-man-woman-queen-the-marvelous-mathematics-of-computational-linguistics/ 8: Wolfram Research, BERT Trained on BookCorpus and Wikipedia Data, 2022, https://resources.wolframcloud.com/NeuralNetRepository/resources/BERT-Trained-on-BookCorpus-and-Wikipedia-Data/ 9: Google Research Inc., Measuring Similarity from Embeddings, 2022, https://developers.google.com/machine-learning/clustering/similarity/measuring-similarity 10: de Siqueira Santos S., Takahashi D., Nakata A., and Fujita A., A comparative study of statistical methods used to identify dependencies between gene expression signals, 2013, Briefings in Bioinformatics, 1-13, https://www.princeton.edu/~dtakahas/publications/Brief%20Bioinform-2013-de%20Siqueira%20Santos 11: North, B. V., Curtis, D., and Sham, P.C., A Note on the Calculation of Empirical P Values from Monte Carlo Procedures, 2002, American Journal of Human Genetics, 439 - 441, https://www.ncbi.nlm.nih.gov/pmc/articles/PMC379178/ 12: Oshop R., Is Textual Similarity of Events Related to Event Chart Similarity?, 2022, www.wolframcloud.com/obj/renay.oshop/Published/Events%20comparisons%20published.nb
A basic video run-through of the above material follows.
|
ARTICLESAuthorRenay Oshop - teacher, searcher, researcher, immerser, rejoicer, enjoying the interstices between Twitter, Facebook, and journals. Categories
All
Archives
September 2023
|
||||||||||||||||||||||||||||||||||||
© 2008–2024 Renay Oshop AyurAstro®



 RSS Feed