
 Abstract The belief in a correspondence between the planetary positions at the time of a world event and those at a similar event at another time is ancient and still claimed today (Tarnas, 2006). Using a database of 6770 dates of world events after January 1, 1600, AD from Wolfram Research, the short descriptions that accompany each date are quantified using 1536 long embeddings from OpenAI. Embeddings, a gift from machine learning, are a precise way to measure similarities between text. They were used here to quantify similarities in short descriptions without dates of pairs in 6770 world events post-1600 AD as found in a provided database. There are 22913065 unique such possible pairs. The zodiacal placements of the charts were also calculated for either the actual date at midnight of the event or the same but using the start date for a multi-day event. Only Sun, Moon, Mercury, Venus, Mars, Jupiter, Saturn, Uranus, Neptune, Pluto, North Lunar Node, and South Lunar Node Tropical degree placements from zero to 360 degrees were computed. Finding the mean of the Cosines of the differences between planetary placements for two events offers a neat and novel way of measuring similarities between these zodiacal placements for the two events. These metrics for textual similarities and chart similarities when plotted against each other suggest non-monotonic dependence with effect size between the chart extrema being 0.380. The upper p-value for independence between the two metrics is less than 0.0001 as computed by Hoeffding’s dependence measure. The conservative Monte Carlo approach to estimating the upper value of this p-value was necessary due to physical computation constraints. Thus, likelihood for the alternative to independence, namely dependence, between event textual similarities and event chart similarities is shown. A classifier for an event date being war-like or peace-like as decided by similarity of the embeddings for the event’s full description to the embeddings for the words “war” and “peace” respectively was successful as built on event zodiacal placements only. Introduction World events are often used in astrology studies. Accurate places, dates, and times are typically known even when they are not precise, allowing for a bridge between astrological placements and interpretation of social, cultural, and personal significations. Studies of the correlation between celestial positions and world events are ancient. Over six centuries during the first millennium BCE, scholars in Mesopotamia recorded nightly celestial positions and terrestrial events onto clay diaries known as menologies. So, while they might log a full moon aligned with Venus in the constellation of Taurus, they also recorded mundane events such as the price of grain, the water levels in the Euphrates River or an earthquake (Sachs 1988) (Rochberg-Halton 1991). Rarely however do these studies include enough events to achieve statistical significance for the interpretations drawn. This practice has continued into modern times. Cultural historian, Richard Tarnas documents historical evidence to support a correspondence between mundane events and astrological alignments in his book, Cosmos and Psyche (2006). The problem with verifying these claimed correlations statistically is that it is hard to measure such a diverse range of events objectively and consistently. Here I use a textual description of 6838 historical events in relation to astrological placements at the time of the event. Across many millions of pairs of events, is the size of difference in textual descriptions (which contain words loaded with social, cultural, and personal significance) related to magnitude of difference in astrological charts for the two events? I will be exploring quantitative equivalencies for most of the concepts within this question and then use appropriate mathematics to answer it. Materials and Methods Full code is available, including for the generation of event data (Oshop, 2023). Almost all of the calculations in this study were performed through the professional mathematics software, Mathematica, which offers many tools. One of those is a database of 7818 historical events (Wolfram Research, 2012). Included in the database for each event is a one sentence text-description (e.g., "Apollo 8 Returns to Earth") and the start date (e.g., December 27, 1968). Source information and metadata is not available for this database beyond assurances that it is continually being updated (Wolfram Research, 2022) (Wolfram Research, 2022). Unfortunately, this database is anglophone-centric, but alternatives are hard to come by as simple and easily accessible event databases are surprisingly rare. The data was pared down to 6838 events from 7818 by excluding dates prior to 1600 AD and all events whose start date was January 1. The first was to reduce uncertainty resulting from the switch from the Julian to the Gregorian calendar that was phased in globally from 1582 AD. The latter was to obviate a problem with the database, wherein uncertain dates for events were sometimes listed as January 1 of the year. All numbers and other specifying qualifiers were also algorithmically removed from the database event descriptions. This was to avoid an artificial connection. For example, “The Battle of 1812” could be unrelated to another event that has the year 1812 in its description. (So, “The Battle of 1812” is reduced to “battle”.) Care was also taken to ensure that there were no duplicates in the event database. Finally, removing these qualifiers in the chart descriptions to make them unspecific sometimes removed all the words in the description. Such empty event descriptions were removed from consideration, further limiting the number of events to 6770. The removal process was considered necessary to remove most artefacts of association through excessive adjectives. So, for example, “earthquake" was the desired distillate and not full descriptions of earthquakes which may have been chained together in a region in 1912. Table 1 shows the difference between the hands-off, automated distillates and original event descriptions from a random selection. Note that contemporary embeddings in general are robust enough to know when to treat names in the distillates as capitalized. For specific methods of the distilling algorithm, see the code. (Oshop, 2023)
A timeline histogram of the resulting 6770 events follows in Figure 1. 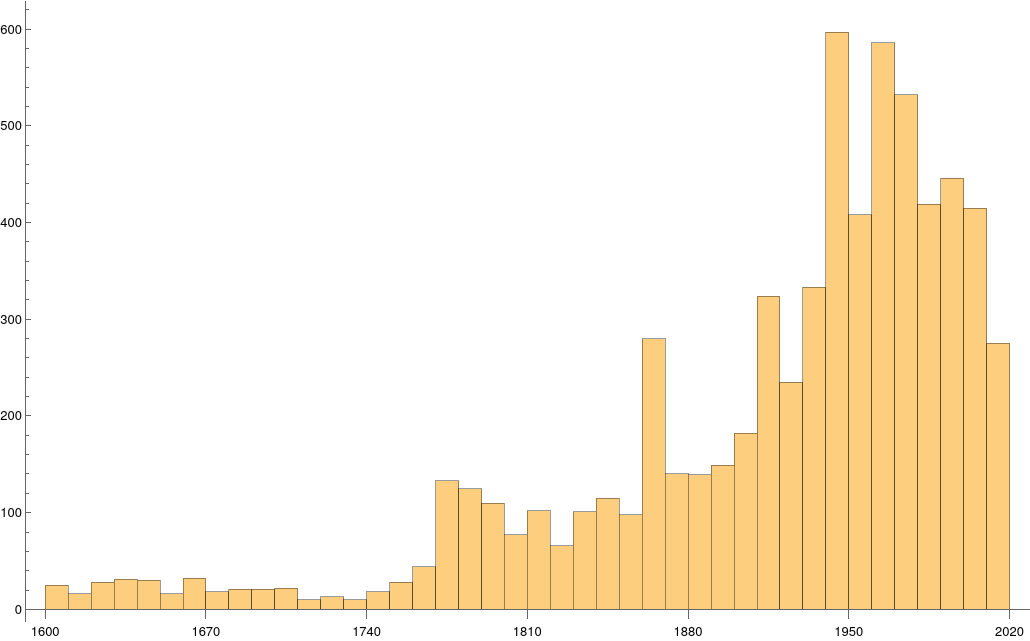 Figure 1: Timeline histogram of the 6770 events in the database that occur after January 1, 1600, AD. In Figure 2 is a word cloud of the most frequently used words in the 6770 event descriptions. 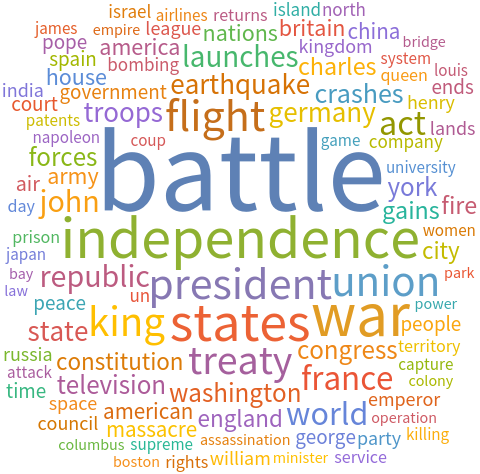 Figure 2: The most frequently used words in the 6770 event descriptions after dates and other qualifiers are algorithmically removed. Measuring Textual Description Similarities Allowing for high precision in quantitatively measuring qualitative texts, embeddings were introduced in 2003 in a paper that states that they “associate with each word in the vocabulary a distributed word feature vector … The feature vector represents different aspects of the word: each word is associated with a point in a vector space. The number of features … is much smaller than the size of the vocabulary” (Bengio, et al., 2003) (Aylien.com, 2022). These embeddings embody a literal “geometry of meaning” (Gärdenfors, 2017). To share an example from computer science literature, subtracting the embedding numbers for “man” from those for “king” and then adding those for “woman”, one gets the numbers that closely align with “queen” (MIT Technology Review, 2015). So, king - man + woman = queen. The calculator for embeddings used for this study was developed by OpenAI, was released in 2022, and uses the "text-embedding-ada-002" model. It results in a vector, a list, that is 1536 numbers long for each event’s deconstructed description. Each of the 1536 numbers in the vector is critical to fully describing the textual quality of the event description but in quantitative terms. Going from two 1536-featured vectors for each event pair to a single number is done by measuring the cosine distance between each pair’s event embeddings (Google Research, 2018). In general, as similarity between two vectors increases, cosine distance decreases. Measuring Chart Similarities The celestial positions are measured in geocentric ecliptic longitude. While this is the same metric as the Tropical Zodiac, the values are expressed between 0° and 360° from the Vernal Point or 0° Tropical Aries. For each event there are separate degrees for Sun, Moon, Mercury, Venus, Mars, Jupiter, Saturn, Uranus, Neptune, Pluto, North Lunar Node, and South Lunar Node, thus creating a 12-number-long vector for each. Reduction to a simple number was made by taking the average of the twelve cosines of the twelve angle distances for each pair. Comparing the 12-digit vectors for these zodiacal placements could be done by dot product, but that would miss some key features of astrology charts. We consider charts to be highly similar or conjunct when their degree differences, i.e., the results of their degrees’ subtractions, are either close to zero or close to 360 degrees or -360 degrees. Nicely enough, there is a trigonometric function that behaves exactly this way: the cosine. The simple plot of it follows, wherein you can see that the blue line has maxima at 0 degrees, 360 degrees, and -360 degrees. 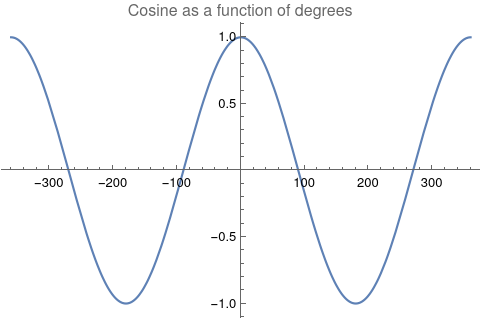 Figure 3: Cosine as a function of degrees Moreover, there are other qualities of the cosine curve that preserve information from astrology. Oppositions at +/- 180 degrees yield a cosine of -1, and +/-90-degree squares yield a value of zero. These parallel the astrological interpretations wherein squares suggest no similarity, and oppositions do show similarity but of an opposite polarity as conjunctions. Degrees in between the extrema have cosine values that are appropriately in between as well.
There exists a consistent bridge between astrological terminology and cosine value of degree differences between two events. Thus, for each of the two events in an event pair, the twelve placements of the second one was subtracted from those of the first one. Applying cosine to each of the twelve differences and then doing a simple average gives a single-number result that is a straightforward summary for the chart similarities of the 12 astronomy features. Measuring the Relationship Between the Texts and the Planetary Positions Next is the assignment of detecting dependence. Note that this is different than correlation. For example, a quartic is a function of the order of x raised to the fourth power. The resulting graph shows for each x one f(x), but it is not so that each f(x) only corresponds to one x. Parabolas, hyperbolas, and certain trigonometric functions such as cosine depicted above behave similarly. Thus, one can say for these that f(x) is indeed a function of x, but not in a monotonic fashion. The idea of monotonic dependence is also known as correlation, but for these special non-monotonic functions, we need to consider tests for dependence and not correlation. In short: For dependency: determine that a variable has a value that depends on the value of another variable. For correlation: the relationship between variables is linear and is considered as correlation. That is, as one similarity increases the other uniformly increases or decreases too. This paper’s study answers a question not about correlation but about the more sophisticated situation of dependence. To do the answering, a tool that can compute not just linear dependence (i.e., correlation) but also non-linear dependence, namely Hoeffding’s D (for dependence) measure, was selected. Each Hoeffding D measure test was found to take about 16 seconds to compute for 100,000 event pairs, 22 minutes for 1,000,000 event pairs, and an unknown amount for the full event pairs that number over 25 million. The latter is unknown because the computation was aborted after six days. (The computer that was used is running Linux on an AMD 3950x CPU with 64 GB DDR4 RAM.) Thus, a Monte Carlo approach was needed to estimate the upper-bound “p-hat” of the actual full p-value for independence. The approach consists of breaking up the problem into computing the p-value 10000 separate times for randomized sets that number 100000 pairs each. The equation for this conservative upper bound is simply (r + 1) divided by (n + 1), where r is the number of runs that yield a test-statistic above that which is desired (here corresponding to a p-value of alpha 0.05) and n is the number of separate times the randomization is run (here equal to 10000). All that is needed is r. Results In the Monte Carlo simulation, r = 0, yielding a p-hat upper value for p of (0+1) divided by (10000+1) which is less than 0.0001. To make it simpler to see the relationship between chart similarities to their embedding distances, here is the scatterplot of measurements in blue with their best fit line. 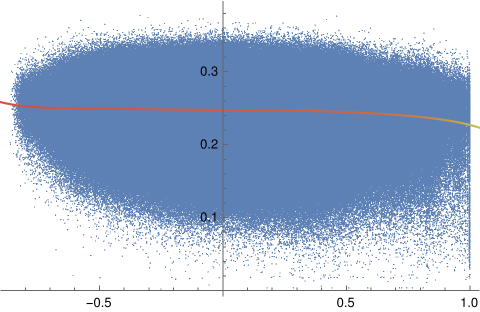 Figure 4 The three-dimensional histogram edition is shown in Figure 5 wherein a subtle shift from higher counts in the upper left dropping to the lower right is seen. As the charts become more similar, description distances become smaller, and description similarities become greater. 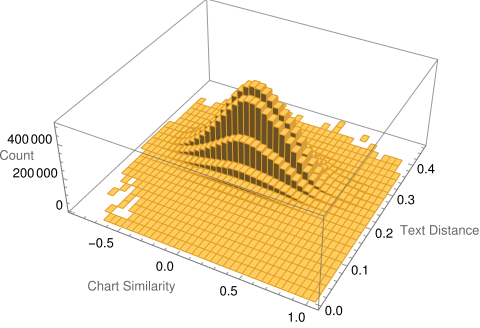 Figure 5: Counts of chart similarity and description distance. The general trend is subtle but clearer in Figure 6, wherein the nonlinear, algorithmically determined, best fit curve is shown, y=0.263316−0.00117471x+0.000483782x^2−0.00429352x^3−0.00573389x^4=0 which has an adjusted R-squared of 0.988 for fit and ANOVA p-values for coefficients that are far less than 0.0001. The relationship between the two variables is not monotonic which explains why dependence and not correlation is more proper. 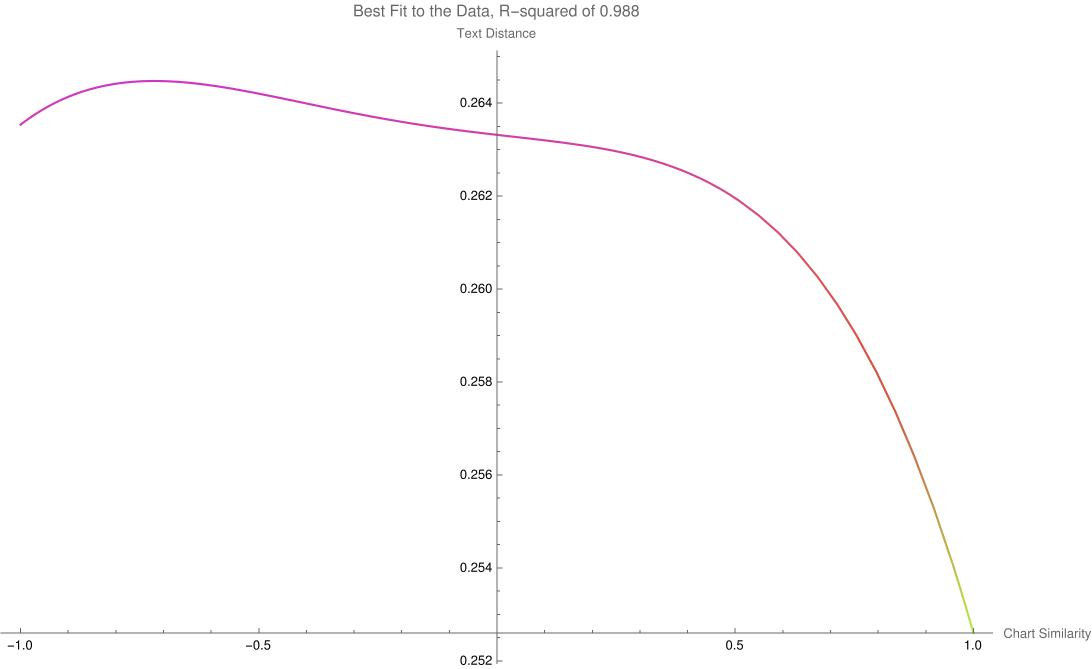 Figure 6: Trend of event pair chart distances and text description pair distances The effect size (Cohen’s D) in text distance when the chart similarity is one, compared to when it is minus one, is 0.380. A functional relationship between historical event text descriptions and historical event celestial placements is thus established. Successful classifier test To further test the utility of this relationship, each event description's similarity to the single-word texts of “war” and “peace” was found through cosine distance of their embeddings. Where the similarity to “war” was higher, the event’s astronomy chart set was associated with the classification of W, else the event astronomy was classified as P. Cloneable data is accessible. (Oshop, 2023) After a random 80%-20% split of data into a training set and test set, the best performing model (determined via cross-validation) was a boot-strap decision forest model. The top field importances for the model are Saturn (4.52%), Sun (4.64%), Uranus (5.12%), Pluto (10.98%), and Neptune (54.25%). Access to the interactable and cloneable model is also available (Oshop, 2023) Testing the model on the 20% test set yielded success in classifying P 95.5% of the time and W 22.9% of the time, outperforming both random choice and modal choice in recall, accuracy, precision, f-measure, and phi-coefficient. More extensive, interactable, and detailed results are available. (Oshop, 2023) Conclusions A function for similarity applied to historical event descriptions is shown to be a function of chart similarity with a p-value for independence that is far lower than 0.001. Calculating similarities between the celestial degrees on any arbitrary day and those of the nearest events in the database (even when full descriptions are not known) based on that astrology is nearly trivial. The demonstrated loose similarity of charts to these events’ descriptions may allow for some mundane event prediction. This study brings us closer to that potential future. As a demonstration of the general utility of the astronomy chart of an event holding predictive power, a classification of event astronomies into war or peace was found to have more utility than either a random 50-50 choice or choosing the more common peace classification each time. One may apply this classifier to future astronomies. As a preliminary result, it does indeed seem there is a time for war and a time for peace, as well as astronomical ways to understand a moment’s relationship to historical events that have gone before. All material for replication is included in references. (Oshop, 2023). References Aylien.com (2022) An overview of word embeddings and their connection to distributional semantic models, https://aylien.com/blog/overview-word-embeddings-history-word2vec-cbow-glove Bengio Y., Ducharme R., Vincent P., and Jauvin C. (2003) A Neural Probabilistic Language Model, Journal of Machine Learning Research, 1137–1155, https://www.jmlr.org/papers/volume3/bengio03a/bengio03a.pdf Gärdenfors P., The Geometry of Meaning (2017) MIT Press https://mitpress.mit.edu/books/geometry-meaning Google Research Inc. (2002) Measuring Similarity from Embeddings, https://developers.google.com/machine-learning/clustering/similarity/measuring-similarity MIT Technology Review (2015) King - Man + Woman = Queen: The Marvelous Mathematics of Computational Linguistics, https://www.technologyreview.com/2015/09/17/166211/king-man-woman-queen-the-marvelous-mathematics-of-computational-linguistics/ Oshop R. (2023) Is Text Similarity of Events Related to Chart Similarity? https://www.wolframcloud.com/obj/renay.oshop/Published/EventsComparisonCode.nb Oshop R. (2023) BigML Cloneable Data https://bigml.com/shared/dataset/y5gOLoQb1y9Ikkhgi9st8ASDXXd Oshop R. (2023) BigML Cloneable OptiML https://bigml.com/shared/ensemble/6AitpIkSL1tYyAEi1WCYMsZqDMi Oshop R. (2023) BigML Test Set Results https://bigml.com/shared/evaluation/9HxONbPHG3iVER1FxfgRzHMKZVS Rochberg-Halton, Francesca (1991) The Babylonian Astronomical Diaries. Journal of the American Oriental Society Vol. 111, No. 2 (Apr. - Jun.), pp.323-332 Sachs, A.J. & Hunger, H. (1988) Astronomical Diaries and Related Texts from Babylonia, Austrian Academy of Sciences, Vienna. Tarnas, Richard (2006) Cosmos and Psyche: Intimations of a New World View, New York: Viking Wolfram Research (2012) EventData, https://reference.wolfram.com/language/ref/EventData.html Wolfram Research (2022), Frequently Asked Questions, https://www.wolframalpha.com/faqs/ Wolfram Research (2022), Wolfram Knowledgebase, https://www.wolfram.com/knowledgebase/ Full paper PDF download :
1 Comment
Your comment will be posted after it is approved.
Leave a Reply. |
ARTICLESAuthorRenay Oshop - teacher, searcher, researcher, immerser, rejoicer, enjoying the interstices between Twitter, Facebook, and journals. Categories
All
Archives
September 2023
|
||||||||
 RSS Feed
© 2008–2024 Renay Oshop AyurAstro®