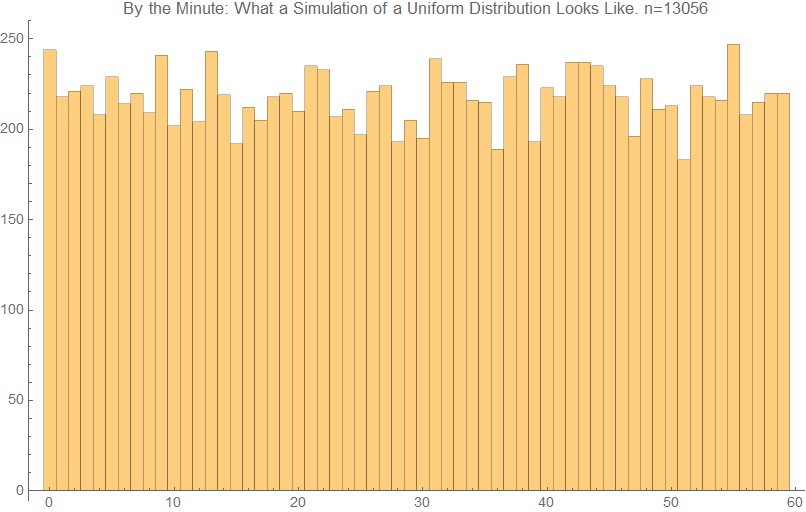
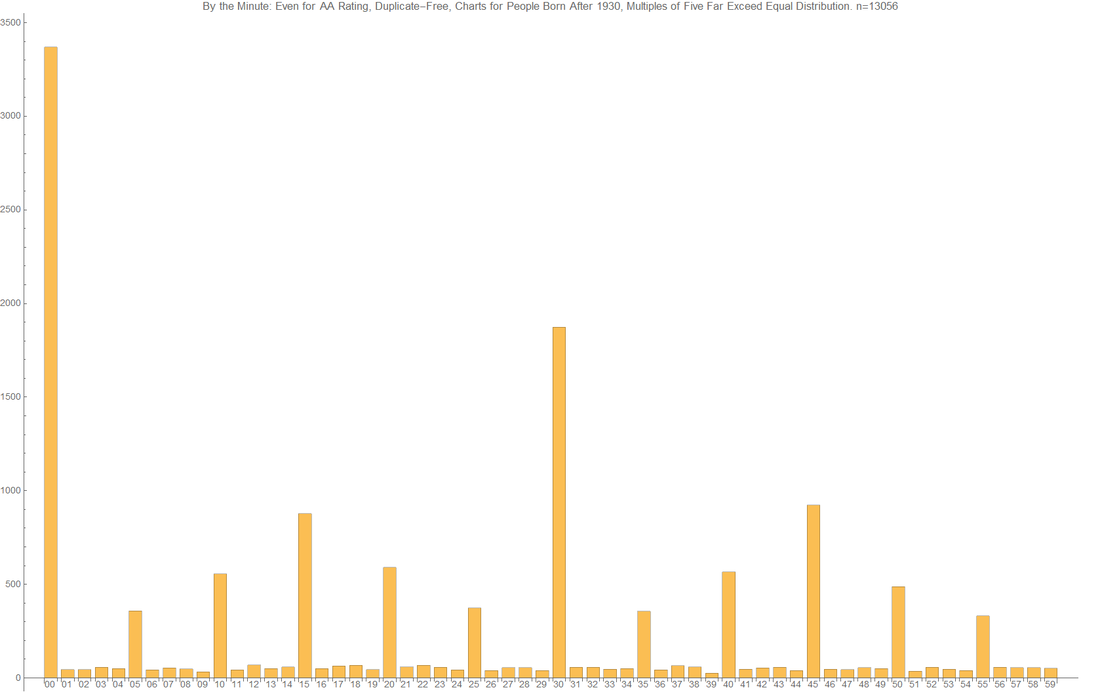
Even AA Rating Charts in Astro-Databank of People Born After 1930 Are Highly Likely to be Wrong1/17/2018 Astro-databank is the resource for researchers in astrology. It is a repository of birth information of many thousands of people and events and includes biographic data as well as the birth time, place, and date. Of high utility is the included Rodden Rating which tells us the accuracy of each chart. An AA rating is "Data as recorded by the family or state". The expectation of many researchers is that AA data is of the highest accuracy possible and can be used freely. In the following, I show statistically that it is extremely unlikely that the AA rating charts altogether are accurate. I will be considering charts of people only and only those born at or after 1930. From here on, I will try to state things as explicitly as possible. The common assumption (the null hypothesis) is that AA rating charts are all of high accuracy and hence, taken altogether, exhibit behavior of high accuracy. My assertion (the alternate hypothesis) is that AA rating charts do not exhibit behavior of accurate birth data. One behavior of accurate birth data is that the minute of birth is evenly distributed. That is to say, a birth time of 8 minutes after the hour is not expected to happen much more or less than a birth time of 9 minutes after the hour, for example. The following is a simulation of a uniform distribution so that you you know what its plot looks like. As you can see, there is variation, but no bar is wildly higher or lower than another bar. On the whole, the bars are even, more or less. The statistical test that I will be using to test a match of the Astro-databank data to a discrete uniform distribution is called the Pearson's chi-squared test. If its result is less than 0.05, then the data is generally considered unlikely to be from that distribution. For example, in the randomized computer simulation above, the test statistic is 57.6489 with a p-value of 0.525436 which is consistent with it belonging to the discrete uniform distribution. For the minutes of charts of people born after 1930 in Astro-databank with the highest AA rating, do they fit a discrete uniform distribution? No. For a sample taken from the first 13,056 such charts (the largest practical one for the limits of my computer), the test statistic is 63.7 and the resultant p-value is 7.18058*10^-10. Again, any p-value less than 0.05 is generally considered statistically significant. Thus, the alternate hypothesis is supported. As a comparison to the above graph of an even distribution of birth minute, look at the graph for the AA charts: Bottom line: across thousands of charts, the birth minute in AA ranking data of people in Astro-databank is likely to be rounded to the nearest 5 minutes, even more likely to be rounded to the nearest ten minutes, even more likely than that to be rounded to the nearest fifteen minutes, even more likely than that to be rounded to the nearest half hour and even more likely than that to be rounded to the nearest hour. While Astro-databank remains an invaluable overall tool for researchers, birth minute in Astro-databank, generally speaking, is not useful. Calculations and source files are below.
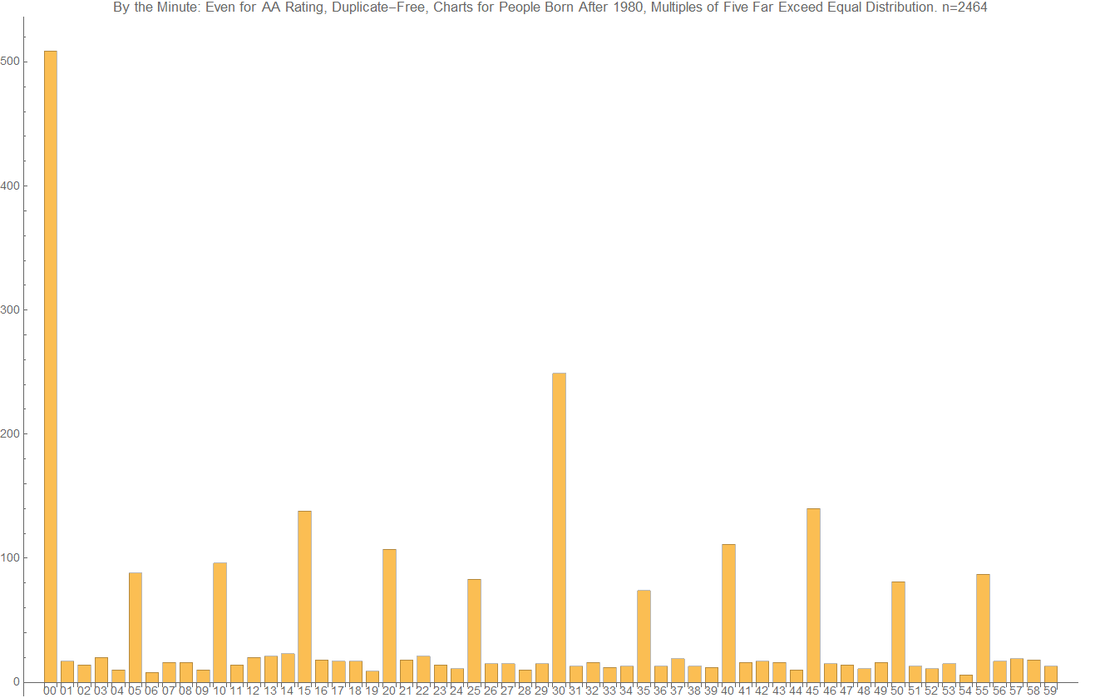
[Postscript: for those who would like to see the data only for people who are born at or after 1980, here you go. P-value is 3.30016*10^-22. So, the situation is even worse.]
6 Comments
4/16/2020 06:07:17 am
Hi,
Reply
4/16/2020 08:53:02 am
Hi Vivek! Thank you for your comment. I agree with the majority of everything that you say. I make heavy use of divisionals, so I typically need to rectify the chart. The upper divisionals can change with a delta of even one minute. (Btw, I use the D16 for twins per an instruction by Hart de Fouw.)
Reply
4/16/2020 09:10:43 am
Also, note the bottom graph. It addresses your concern about more recent dates,
Reply
3/10/2021 03:08:10 pm
If I would add anything to the above article, it would be to point out that precision as distinct from accuracy may still be strong enough for you to use the Astro-databank data. It depends on your use case.
Reply
Jonah Dempcy
4/23/2024 04:53:18 pm
Thank you so much for doing this work! Is it fair to say that if the birth time is not listed at five minute increments then it does follow the uniform distribution and is more likely to be accurate? In other words if we remove the 12 possible times that defy uniform distribution, we are left with 48 possible times that are expected to be highly accurate. Is that fair to say?
Reply
Renay Oshop
4/23/2024 05:17:50 pm
Hi Jonah!
Reply
Your comment will be posted after it is approved.
Leave a Reply. |
ARTICLESAuthorRenay Oshop - teacher, searcher, researcher, immerser, rejoicer, enjoying the interstices between Twitter, Facebook, and journals. Categories
All
Archives
September 2023
|
||||||||||||||||||
© 2008–2024 Renay Oshop AyurAstro®


 RSS Feed