|
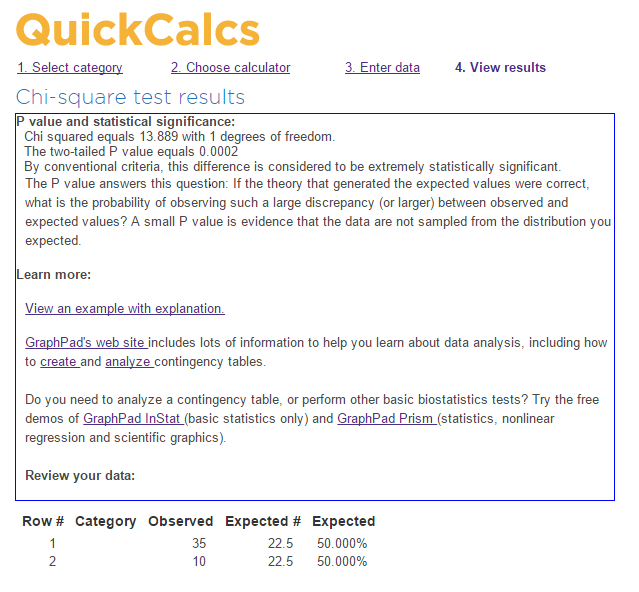
I decided to test a recent theoretical development of how football game winners can be seen in the day, place, and starting time of the event. Accordingly, my assistant drew up a table of all Super Bowls so far and their event information. I then drew up each chart and made a prediction. These were then checked against the real winners. I should preface by saying that I am a football agnostic. I do not know much about football, only watching socially for a few minutes here and there and receiving the good-natured teasing of friends for knowing so little. I want to admit that I have seen some games at some times, enough to develop the model, yet I feel I can judge these past charts fairly, truly without any a priori knowledge of the winner. Thirty five out of forty five Super Bowls were evaluated correctly. (Five early Super Bowls did not have recorded start times available.) Final 2-sided p-value is 0.0002. To do this project even more fairly, I would recommend the following:
0 Comments
Your comment will be posted after it is approved.
Leave a Reply. |
ARTICLESAuthorRenay Oshop - teacher, searcher, researcher, immerser, rejoicer, enjoying the interstices between Twitter, Facebook, and journals. Categories
All
Archives
September 2023
|
© 2008–2024 Renay Oshop AyurAstro®


 RSS Feed