I have posted a few times here about a rich dataset that I have.
Data were obtained from Stanford’s SNAP data repository of Amazon.com reviews that gave daily misspelling rates; astronomical data were from Wolfram’s Mathematica software and its astronomy resources.
Here is what the dataset looks like:
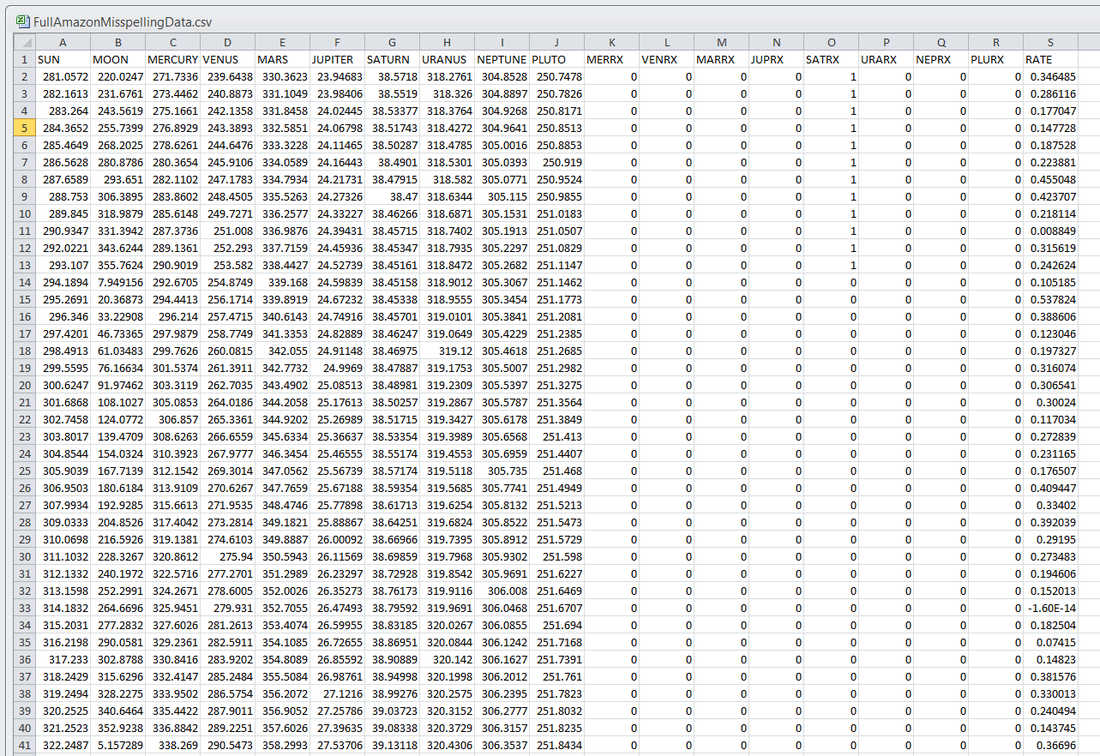
Each of the 5296 rows represents a sequential day in a 14.5-year span of Amazon review misspelling rates during Jan 1, 2000 to Jul 1, 2014.
Across the top are the labels. In each column is a simple, stable, linear function of the right ascension (i.e., the astrological Tropical degree) of the planet, moon, or star at midnight at the start of that day in London, UK. Retrogressions of the planets are also included.
The final column is the log of difference of the misspelling rate of the day from the 27-day SNIP baseline. (The Moon’s right ascension completes its cycle every 27 and change days — the shortest cycle for any of the right ascensions.) Thus, it is the data over time minus its background noise. The following is a graph of this column’s data over time:
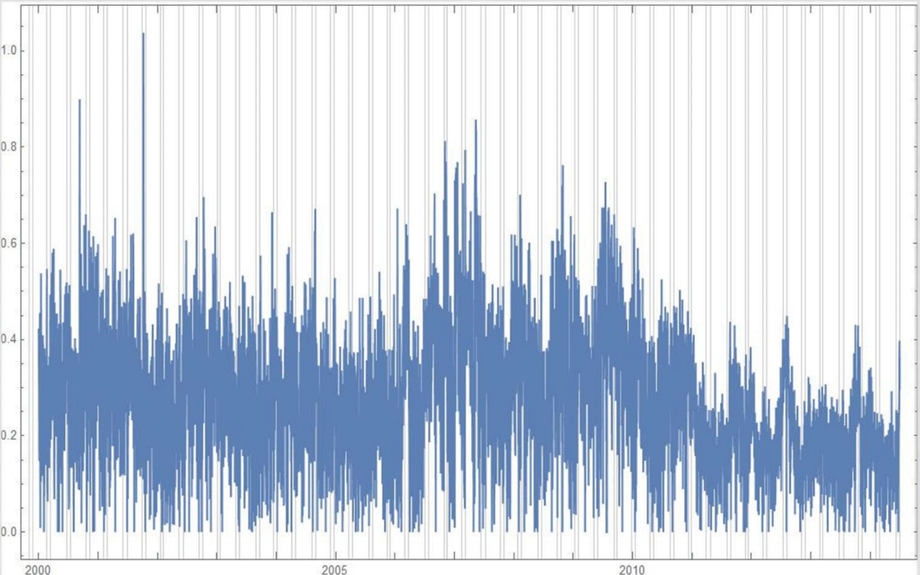
SNIP stands for Sensitive Nonlinear Iterative Peak-clipping algorithm. This method preserves any cyclic patterns — such as the planetary placements and retrogressions — while discarding “background noise” in the data, which would tend to obfuscate the patterns. The SNIP method is not subjective; it comes out of processing signals within spectra and is unprejudiced. It tends to preserve cyclic behavior in spectra.
The apparent cyclicity hidden within this data is revealed via a correlogram:
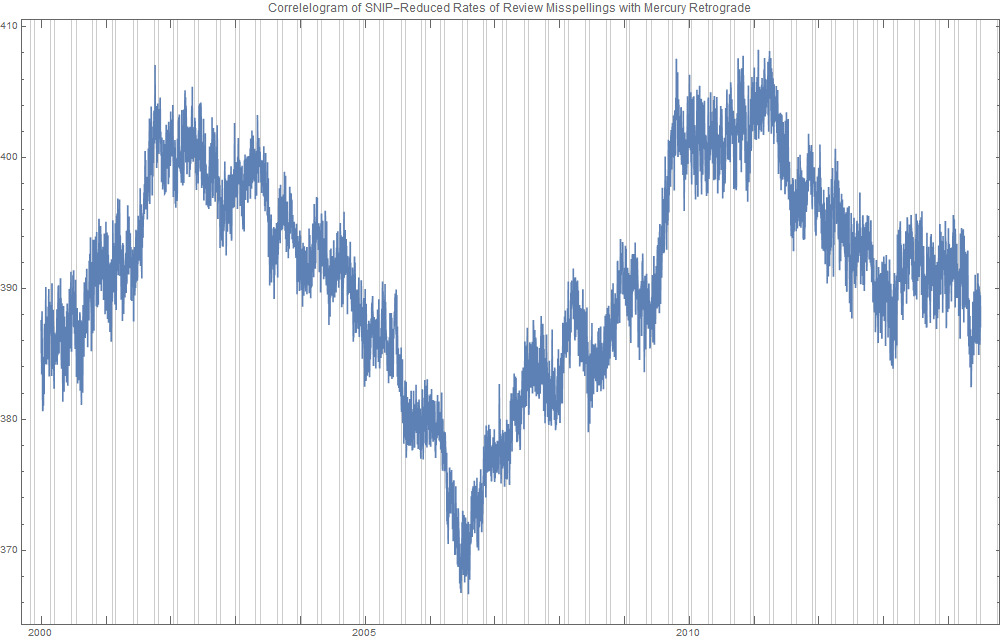
The thin bands represent the start and end of Mercury retrograde across 14.5 years — Mercury retrograde analysis being the original motivator for acquiring this data.
For today’s study, the data for the first 80% of days were developed into a training group, and that of the subsequent 20% of days were isolated as a test group for prediction.
What was doing the training and testing? They were done entirely by an automated machine learning (AI) algorithm from BigML.com called DeepNet. DeepNet* was applied to the training set of the first 80% of days. This DeepNet was then tested or evaluated on the last 20% of days. The DeepNet is a hands-off technique offered to anyone for free.
The chart below displays ridiculously good results as given in the usual AI industry way: the error rates for predictions for the 20% test group by DeepNet (in green) is dramatically smaller than other standard methods of prediction, in gray, which are based on the mean (average) rate of the training data or an approach assuming random chance. Moreover, the strong R-squared suggests good correlation of predicted misspelling rates to actual values only for the astronomical data of the DeepNet.
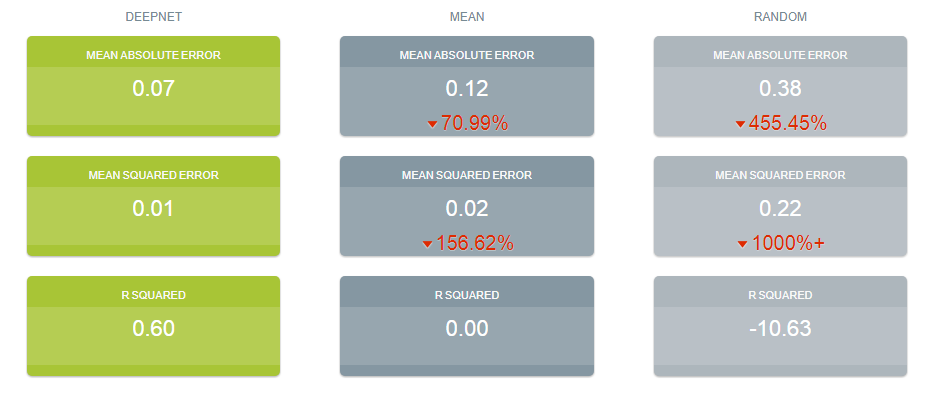
Let me summarize my take: future misspelling rates in Amazon reviews were successfully predicted using only basic astronomy data when compared to random values or when the average (mean) value was repeatedly applied. Moreover, there was a fine fit of correlation of the model’s predicted values to the actual values as shown by the R-squared.
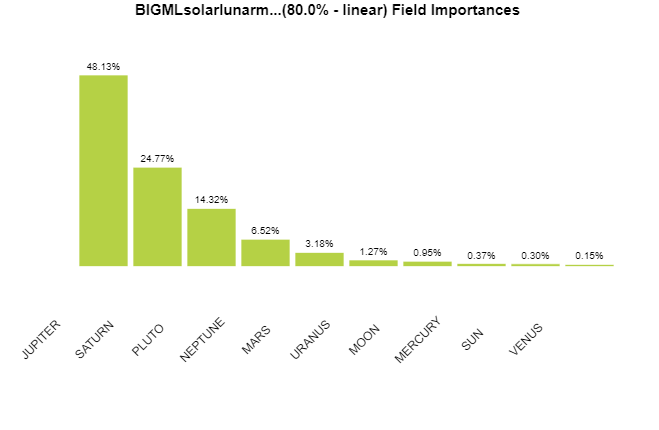
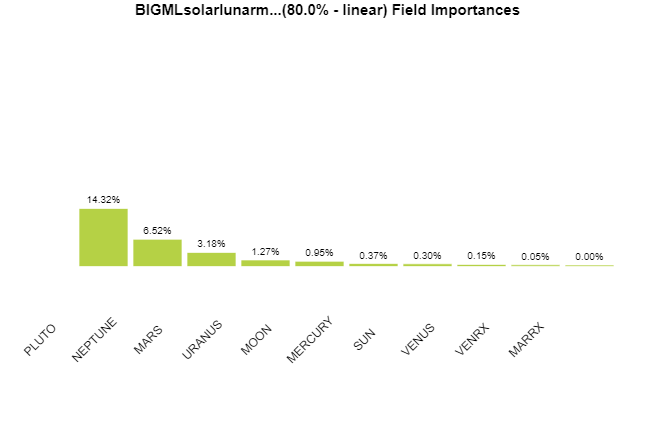
Here are the DeepNet fields in order of importance:
I am not even sure what to do next, but in case you do, here is the spreadsheet:
Download fullamazonmisspellingdata.csv (783 kb)Please let me know what you find, and please reference this post if you use the dataset.
* For an instructable on exactly how I did this, see here. Note that a linear split was used.
I wrote this in February 2018 and left the dataset here for anyone who wanted it. Eight years on, somebody finally took me up on it. It was me.
This is the sixth and last of the notes I have appended to my Mercury retrograde work. The first article carries the general argument and I will not repeat it. This page has a specific problem, and it is a big one.
I compared my machine to nothing, and reported the walkover
Look again at what I put up as evidence. DeepNet returned a mean absolute error of 0.07 and an R² of 0.60. I set that against two comparisons of my own choosing: the mean
of the training data, at 0.12 and 0.00, and random
, at 0.38 and −10.63. Against those, 0.60 looks like a discovery, and I called it ridiculously good.
But look at what the split actually does. I trained on the first 80% of days and tested on the last 20% — I even flagged it in my own footnote, note that a linear split was used
— and across that boundary the level of my series falls off a shelf. The training days average a rate of 0.293. The test days average 0.187. Something took a third off the misspelling rate of Amazon reviews between 2000 and 2014, and the likeliest something is not Mercury. It is browser spellcheck and phone autocorrect arriving and getting good.
So my mean of the training data
baseline was not a baseline. It was a strawman with its feet nailed to 2005. Here is what happens when you replace it with something that merely notices the level has moved.
| Method | MAE | R² |
|---|---|---|
| DeepNet — what I reported above | 0.070 | 0.600 |
| “Mean” — the baseline I chose | 0.120 | 0.000 |
| “Random” — my other baseline | 0.380 | −10.630 |
| A constant: the last 27 days of training | 0.076 | 0.505 |
| A constant: the last 90 days of training | 0.073 | 0.535 |
| That constant plus a plain seasonal sine wave | 0.072 | 0.562 |
A single number carried forward from the end of my training window — no network, no planets, no astronomy whatsoever — gets a mean absolute error of 0.073 against my DeepNet's 0.070. Add an ordinary yearly sine wave and it reaches 0.072 and an R² of 0.562. My deep learning model, fed the entire solar system, beat a constant and a sine wave by two thousandths of a point of error.
I should say plainly that my machine is not worse than these. DeepNet's 0.60 does edge out the 0.562, and I have reproduced my own mean
row exactly — 0.117 and 0.000 against the 0.12 and 0.00 I published — so this is my setup, not a different one. The point is the size of the claim. The honest margin for the whole apparatus is +0.038, not the +0.600 I displayed in green. I did not measure my model against the best simple thing available. I measured it against the worst, and then reached for the word ridiculously.
What the machine was actually reading
And there is a reason even that +0.038 should not be credited to the heavens. I gave the model, in my own words above, a simple, stable, linear function of the right ascension... of the planet, moon, or star
for every body. But Saturn, Neptune and Pluto do not complete a single circuit of the zodiac in fourteen and a half years. Their right ascensions never wrap even once across my 5,296 rows. Each one tracks the calendar date at a correlation of about 0.99.
Ask my features to predict, instead of the misspelling rate, what day it is: R² = 0.9999. That is not a sky. It is a clock. And a clock is precisely what a model needs to notice that Amazon reviews got cleaner over time. Strip the clock out — keep only the bodies that genuinely go round within my window, the Sun, Moon, Mercury, Venus and Mars — and the sky predicts the rate at 0.024, and at −0.044 when the middle years are held out. Nothing.
My own field-importance chart, further up this page, was trying to tell me this. I looked at it and saw astrology.
And the thing this was all for
The whole project began, as I say above, with Mercury retrograde. So: slide Mercury's retrograde flag along this series to every position it could occupy and ask whether the real alignment is unusual. It is not — p = 0.449. Then do the same for the other seven planets my file flags, which I never once examined. Mercury places fifth of eight. The one that clears the usual bar is Uranus, at p = 0.012, which is simply what a false positive looks like when you take eight bites at a five percent apple. The working is at the foot of the 2015 article, and the test is below.
One last thing, since I asked people to use this file. Fifteen of its cells are not numbers. They read Mod[QuantityMagnitude[UnitConvert[Missing["RetrievalFailure"], "Degrees"]], 360] — Mathematica's ephemeris lookup failed on a few days for Uranus, Neptune and Pluto and wrote its own error message into the column where a longitude belongs. There is a −1.60×10⁻¹⁴ in the rate column too, visible in my own screenshot above if you look at row 33. The flags and the rate are otherwise sound, so nothing here turns on it. But I published this file, asked to be told what people found, and never checked it myself.
Where that leaves me. Please let me know what you find,
I wrote. It took eight years and the person who found it was me, which is the part I would change if I could. What I found is that the machine worked perfectly and learned exactly what I gave it: a calendar, and a fact about Amazon that belongs to software engineers rather than to Mercury. The deepnet is not at fault. BigML did what I asked. The error was mine, and it was made before any of the computing started — in choosing a comparison I was sure to beat, and never once asking what my data would look like if there were nothing in it. I have left this page up, in green, exactly as it was. It is a good record of what it feels like to be wrong while being careful, which is the only kind of wrong worth writing down.