“Mercury retrograde” is, in my culture, a time of great concern.
It is believed by many that the apparent astronomical retrogression affects human communication, use of electronics, and thinking, among other things.
Before May 19, 2015, 2:46 am GMT, the people of Earth were not experiencing apparent Mercury retrograde that month, (I call this time NMR), and after that, they were (MR).
To test the general thesis of an effect on communications during Mercury retrograde, I looked at a randomized 3.13836% of the Reddit comments in May 2015, wherein 31,863,786 submissions (approx. 1.8 million per day) occurred during NMR and 22,640,624 (approx. 2.1 million per day) occurred during MR.
I used the software Mathematica to scan for spelling mistakes, finally comparing the distributions, averages, variances, and their ratios of spelling mistake rates (number of naïve word spelling mistakes in an entry divided by number of words in that entry) during NMR and MR.
I did not edit out common words that are not in the dictionary (e.g., many last names, slang, and swear words) or emojis such as :), and so they artificially increased the spelling error rate. The hope here is that this increase is minimal and approximately uniform across the millions of entries in NMR and MR, but such uniformity is, I believe, a little unlikely and not known by me, regardless. The uniformity level could be easily tested, however.
What were not included for consideration:
- Context mistakes (such as there/their/they’re),
- Digital numbers (0 through 9),
- Internet links,
- Grammar,
- Punctuation,
- Capitalization errors,
- Non-English entries,
- If the entire post was misspelled, it was disregarded to reduce absolutely nonsense entries or entries whose language is not one of the major ones that could be identified by Mathematica.
The numbers of entries thus finally considered were 951,084 during NMR and 674,001 during MR.
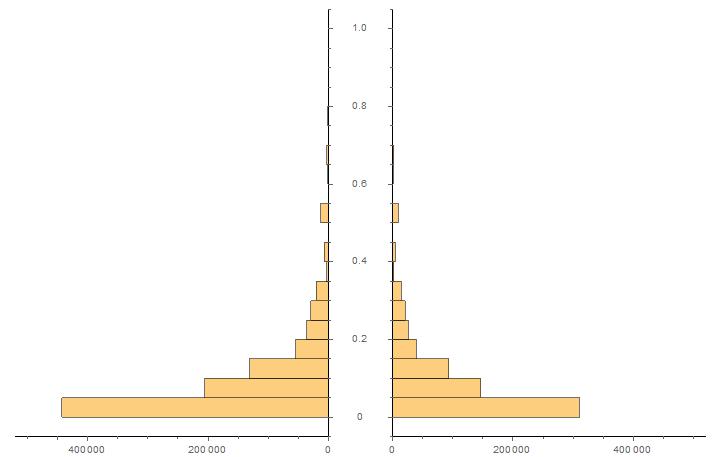
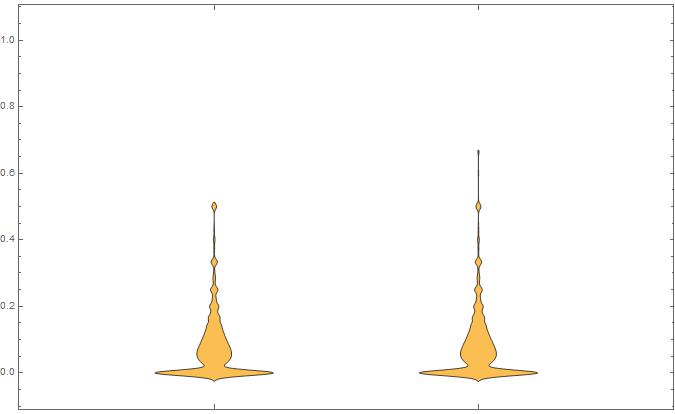
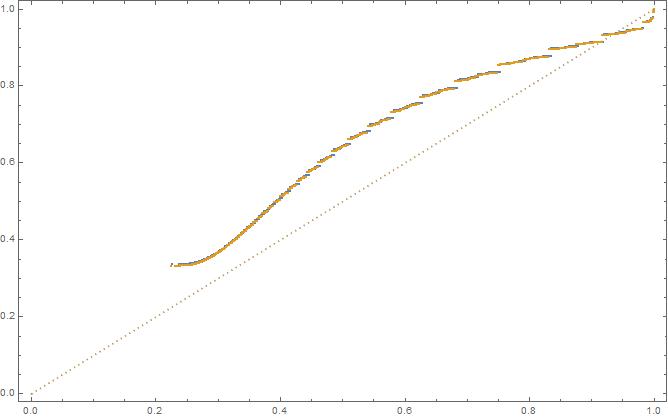
Note that the distributions by histogram are very similar, and the probability plot is visually close to 1:1 (yellow overlapping blue) relative to a normal distribution (the dotted line). Since the distributions are so similar, we can compare the means and variances directly.
The NMR mean is 0.0869656, the MR mean is 0.0881096. The ratio of MR mean to NMR mean is 1.01316. The ratio of MR variance to NMR variance is 1.01399.
Thus, prima facie, average word spelling mistake rates in Reddit submissions in May of 2015 slightly increased by about 1.3 percent during Mercury retrograde and variance of these increased by about 1.4 percent. MR Mean & Variance 95% Confidence Intervals: {0.0878318, 0.0883875} & {0.0135012, 0.0135927}
NMR Mean & Variance 95% Confidence Intervals: {0.0867333, 0.0871978} & {0.0133221, 0.0133981}
Significantly, the confidence intervals do not overlap. In fact, the Kruskal-Wallis p-value for equivalence of medians, where there was a 2.9% increase, is about 2x10^-11 and the Conover p-value for equivalence of variances is about 1x10^-3946 (ha).
Therefore, I believe these slight but significant results do warrant further investigation into Mercury retrograde timed effects on word choices in this May 2015 database in particular, and that the data does somewhat support the thesis of a pervasive effect on communication in humans, at least during this particular Mercury retrograde.
A more far ranging horizontal study across more Mercury retrogrades would be welcome though, especially since some are described as worse than others, and so the effects based on entry topics specific to the windows can be smoothed out.
I would submit to telecommunications companies an easy and perhaps more fruitful challenge: during MR periods, do they experience an increase in technical support call volume, length, and difficulty?
Here, also, is the Mathematica notebook for your review.
Originally published at https://www.ayurastro.com/articles/prima-facie-the-timing-of-mercury-retrograde-slightly-but-significantly-affected-reddit-submission-misspellings-and-other-uncommon-word-choices-in-may-2015
I wrote the piece above in October 2015. I have left every word of it as it was. What follows is what I think of it now, eleven years on.
What I still stand by
The arithmetic is right, and it is all still there for anyone who cares to check it. The notebook is published above, and I would far rather be caught out by a reader than protected by a file I never posted. I listed what I threw away. I hedged the title with prima facie, and I asked for a wider study instead of announcing a discovery. That much I would do again.
Two of the worries I raised against myself have, it turns out, held up in my favor, which I did not know at the time. I fretted that the slang, surnames and emojis I left in might not be spread evenly across the two windows. Going back to the numbers: my 3.13836% sample was evidently chosen to give exactly 1,000,000 entries out of the non-retrograde window, and after filtering I kept 95.1% of those against 94.9% of the retrograde ones. Near enough identical. The junk was uniform after all, and that particular fear of mine was largely unfounded. Both windows are also 33% weekend, so I was not accidentally setting a working fortnight against a pile of Saturdays.
One thing in the piece is simply an arithmetic slip, and I should correct it. I wrote approx. 2.1 million per day
for the retrograde window. It is not. 22,640,624 submissions across the remaining 12.9 days of May is about 1.76 million per day — the same as the 1.8 million before the station. Reddit was not busier during retrograde. As it happens that correction helps me: nothing in the result rides on a change in traffic.
What I no longer believe
The effect is far too small to carry the meaning I gave it. This is the one that stings. Take my own published numbers and compute Cohen's d: about 0.0099. The conventional floor for calling an effect small
is 0.2, so mine is roughly twenty times smaller than small. Said plainly: hand me a random retrograde post and a random non-retrograde post, and the retrograde one is the messier of the two about 50.3 percent of the time. That is a coin flip. I had 1.6 million entries. At that size, a 1.3 percent gap in a noisy rate is trivially easy to find — and so is very nearly any gap at all. My confidence intervals do not overlap, exactly as I said they did not. But I offered that non-overlap as though it spoke to how large the effect was, when all it speaks to is how precisely I had measured it. Those are two different claims, and in 2015 I ran them together.
My extreme p-values were a warning, and I laughed instead of listening. I reported the Conover p-value as about 1x10^-3946 (ha).
The (ha)
was the right instinct and the wrong response. That number sits some 3,600 orders of magnitude below the smallest positive value ordinary double-precision arithmetic can even hold. A p-value is the chance of data this extreme if my model is true, and no heap of 1.6 million noisy text ratios can speak to anything at that resolution. A number like that is not measuring the strength of my effect. It is measuring the distance between my data and my test's assumptions. I should have stopped and asked which assumption had broken, rather than enjoying the absurdity and carrying on down the page.
I treated 1.6 million comments as 1.6 million independent facts, and they are nothing of the kind. Reddit comments sit inside threads, inside users, inside subreddits. The people in one thread are discussing one thing, in one register, and often enough it is the same person posting twice. My effective sample size is therefore far below the number I quoted so proudly, and every p-value in the piece is overstated in consequence. I did not account for this at all.
The real trouble is that I cannot tell Mercury from the calendar. This is the objection I would now put first, and it is fatal on its own. My whole comparison hangs on a single boundary: 19 May 2015, 2:46 am GMT. Before it, non-retrograde; after it, retrograde. But everything after that instant is also simply later in May — a stretch holding Memorial Day weekend on the 25th, the end of the school year here, and whatever the internet happened to be shouting about for that fortnight. With one change-point inside one month, retrograde
and the back half of May
are not two variables. They are one variable wearing two names, and no test I ran afterward could pry them apart. I was comparing May with May and crediting Mercury.
And the mean was the wrong thing to be looking at. My own histograms show it plainly: a great heap of posts at a misspelling rate of zero, and a long thin tail off to the right. The probability plot bends away from the dotted normal line in an obvious S. I wrote that the distributions were very similar
and concluded that I could therefore compare means and variances directly. The two windows are very similar to one another — that part is fairly observed, and it is what the plot was there to show. But their similarity to each other is not their similarity to a normal distribution, and it was the second one my variance comparison was quietly leaning on.
What would actually settle it
The instinct in my closing paragraphs was the right one: a more far ranging horizontal study across more Mercury retrogrades
is exactly what is missing here. Done properly now, it would want many retrograde windows across many years, so that a repeating periodicity carries the argument instead of one lonely boundary. It would want the outcome measure written down in advance, because mean, median, variance and their ratios handed me four chances for something to look interesting. It would want errors clustered by subreddit and by user.
And before any of that, it wants the cheapest test of the lot, the one I never ran: shuffle the retrograde dates. Hand the labels out at random, to dates I know perfectly well mean nothing, and count how often a gap of this size falls out regardless. Writing that sentence shamed me into finally doing it.
The test I finally ran
The first thing I found is that I cannot run it on the data in this article. My 2015 notebook drew from a SQL table on my own machine called May2015, and wrote the per-post fractions out to fractionNMR.csv and fractionMR.csv. None of those survive. What survives is the notebook, and the notebook holds the recipe rather than the ingredients. The boundary is still sitting in it — created_utc 1432003560, which decodes to 19 May 2015, 2:46 am GMT, exactly as I claimed — and so are the two sample sizes, 1,000,000 and 710,544, which quietly confirms that I picked that odd 3.13836% to make the first of them come out round. But the fractions themselves are gone. I cannot re-run my own study. Let that be a lesson of its own: I published my notebook and thought I had therefore published my work. I had published half of it.
So I ran the test on the nearest thing I still have, which is, a little awkwardly for me, the better dataset: my full Amazon misspelling series. 5,295 consecutive days, 2 January 2000 to 1 July 2014, each carrying a misspelling rate and a Mercury retrograde flag, and holding 49 retrograde periods in all. Which is to say it is very nearly the more far ranging horizontal study across more Mercury retrogrades
that I called for in 2015 and then did not carry out.
I did not shuffle the days at random in the end, because that would have been my 2015 mistake wearing a new hat. The rate series is autocorrelated — lag-1 of +0.41 — so a random scatter of days is not an honest picture of what chance looks like here. Instead I rotated. I slid the retrograde flag along the rate series to every possible offset, all 5,294 of them, which keeps the autocorrelation, the number of retrograde days and the twenty-one-day blocks all exactly as they are, and changes only where they fall. That asks the one question worth asking. Not is the retrograde mean higher
— with enough rows something is always higher — but is my real alignment special among all the arbitrary ones?
With 5,295 days I could enumerate every offset rather than sample them, so the test is exact.
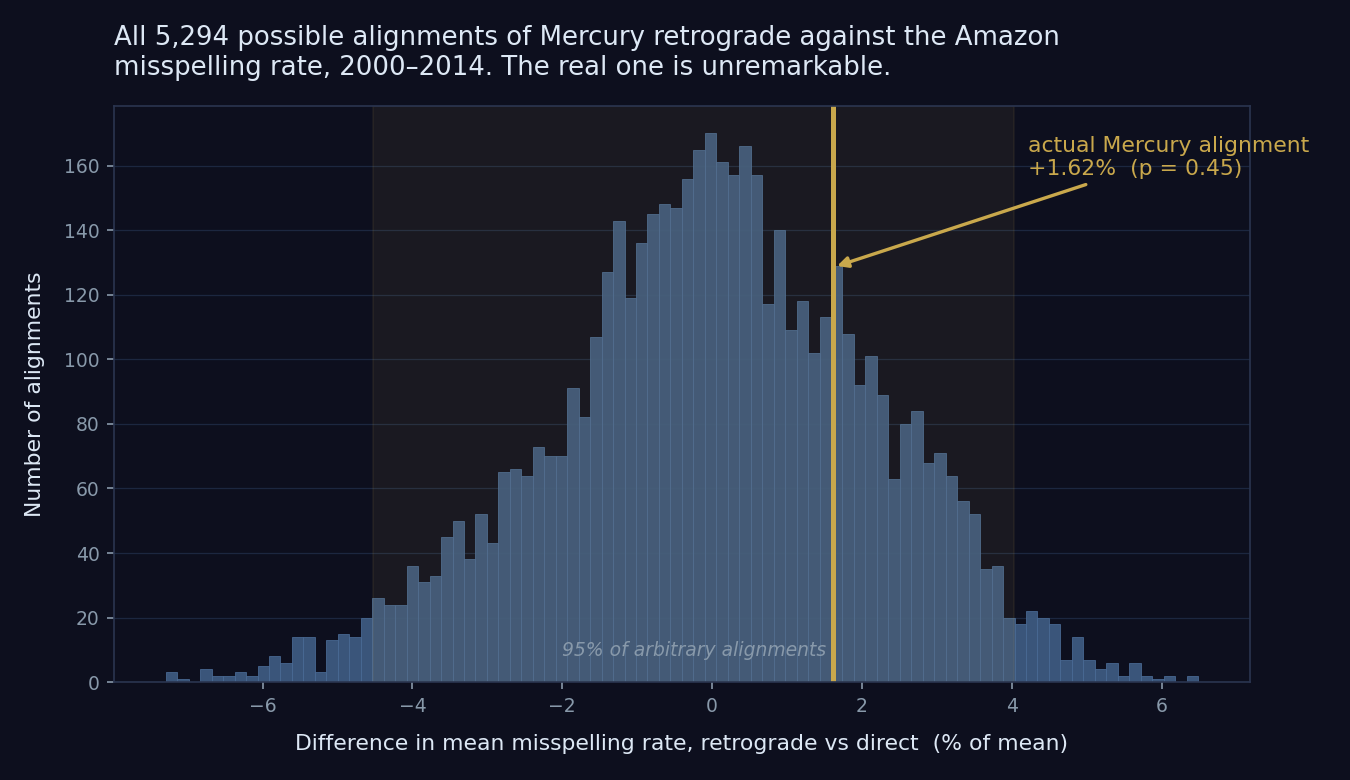
The retrograde days do run high. By 1.62 percent, and in the same direction as my 2015 result — which is precisely why this had to be run rather than assumed.
And it is nothing. p = 0.45. My real alignment sits at the 76th percentile of the arbitrary ones, in the fat middle of that histogram, indistinguishable from sliding the flag to some meaningless place and reading it off there. Adjusted for weekday and for the long drift in the series, p = 0.41. Restricted to the same four-year window my Fourier piece analysed — though that piece worked from a differently-built series of its own, not this one — p = 0.65. There is no arrangement of this data in which the answer comes back different.
The number that has stayed with me is a smaller one. In this same series, the gap between Monday and Thursday is three times the gap between retrograde and direct. The day of the week matters three times more than the planet does.
And here is my worst suspicion above, confirmed. At the level of individual posts, with 1.6 million of them, I got p ≈ 2×10⁻¹¹. At the level of days, an effect of the same size gives p = 0.36 before I have corrected for anything at all. The significance I was so pleased with in 2015 was never living in Mercury. It was living in my decision to treat 1.6 million comments as 1.6 million independent facts.
Both the test and the data are below, so that this time I am publishing the ingredients as well as the recipe.
Where that leaves me. My measurement was real and my code was honest, and neither of those saved me. What I actually showed in 2015 is that two neighboring stretches of a single month differ by about one part in eighty on a noisy proxy for careful typing, in a design that could never have separated the thing I was looking for from the calendar it was sitting on. And when I finally put the question to fourteen years and forty-nine retrogrades, with a test built not to flatter me, the answer came back p = 0.45. I wrote in 2015 that the data does somewhat support the thesis of a pervasive effect on communication in humans.
It does not. The honest word was in my own title the whole time and I did not give it its due: prima facie. At first look. This was a first look, and a first look is not evidence. I said a moment ago that I would rather know than not know. I meant it — and now I know.