
And why not? After all, the exact time, place, and day are known as well as the strength of the effect (in magnitude).
However, a mapping of earthquake strength to solar system events has proven to be elusive, not to be dramatic, but until now.
Inspired by this Kaggle post (https://www.kaggle.com/aradzhabov/earthquakes-solar-system-objects), I decided to try my hand at this perhaps age-old problem, and I found that yes, earthquake magnitude correlates with the moon phase at the time of the event. (Moon phase has been looked at quite often but not with the model I will present today.)
First off, I went to https://earthquake.usgs.gov (https://earthquake.usgs.gov) for the earthquake data. (Thanks to Joe Ritrovato for the link.)
I wanted to look particularly at all earthquakes of any depth between Jan 1, 1975 and Jan 1, 2005. Those years were chosen, because a uniform seismograph was finally used through out the world (https://pubs.usgs.gov/of/2014/1218/pdf/ofr2014-1218.pdf) by the mid-1970's, and hydraulic fracturing with its associated quakes (https://earthquake.usgs.gov/research/induced/myths.php) was not yet in widespread practice (http://www.energytomorrow.org/blog/2016/03/29/americas-fracking-energy-progress). The search was further restricted to earthquakes of magnitude greater than 5.5, following this system (http://www.isc.ac.uk/iscgem/overview.php) of what counts as a serious earthquake. (Some lower limit to the magnitudes was necessitated by the search limit on the USGS site.)
Here is what my search looked like (be sure to also choose earthquakes only below the fold): And here is what you will see if you press enter: If you first choose for the output to be in .csv (spreadsheet) form, then you will get this file: (/uploads/1/1/0/9/11099376/query_5__any_depth.csv) query_5__any_depth.csvFile Size: 2104 kbFile Type: csvDownload File (/uploads/1/1/0/9/11099376/query_5__any_depth.csv) With this data, we can test a model of how moon phases may correlate with earthquake magnitudes.
Here is my model.
My task was to assign these 8 basic shapes a ranking from one to eight. But how to do that?
My thinking is that the new Moon in Vedic astrology is considered a very malefic influence (malefic is a technical term), and so, I shall assign it the 8. Conversely, the Full Moon is the most benefic, and so, it shall be the 1. What about the other shapes? There is also a standard idea in Jyotish, Vedic Astrology, that the waning shapes are more capable of mischief than the waxing shapes.
So the model is very simple and straight from Jyotish but can be implemented by any observer.
So, what happens if we just set up a correspondence between Moon phase number (from the date for the earthquake) and the earthquake's magnitude?
Over the course of the thirty years of the study and 13,623 earthquakes, is there a correlation?
Yes, there is.
I used the Spearman's rho Rank Test for the group and found a correlation rho of 0.0252 (a measure of effect size) with a p-value of 0.00325.
There you go.
Calculations are below.
If you have the analysis software Mathematica and would like the notebook file itself, here is the download. (/uploads/1/1/0/9/11099376/earthquakes_usgs_2.nb) earthquakes_usgs_2.nbFile Size: 704 kbFile Type: nbDownload File (/uploads/1/1/0/9/11099376/earthquakes_usgs_2.nb) To those unimpressed by the correlation rho of 0.0252, this MiniTab post (http://blog.minitab.com/blog/adventures-in-statistics-2/regression-analysis-how-do-i-interpret-r-squared-and-assess-the-goodness-of-fit) is an easy-to-read explanation of why that is not necessarily worrisome. The post then describes doing an F-test (http://blog.minitab.com/blog/adventures-in-statistics-2/what-is-the-f-test-of-overall-significance-in-regression-analysis) as the next step to look at significance when one has a low rho. Here are the results of the F-test.
DF SumOfSq MeanSq FRatio PValue
Model 7 2.86487 0.409267 2.37283 0.0201455
Error 13615 2348.32 0.17248
Total 13622 2351.19
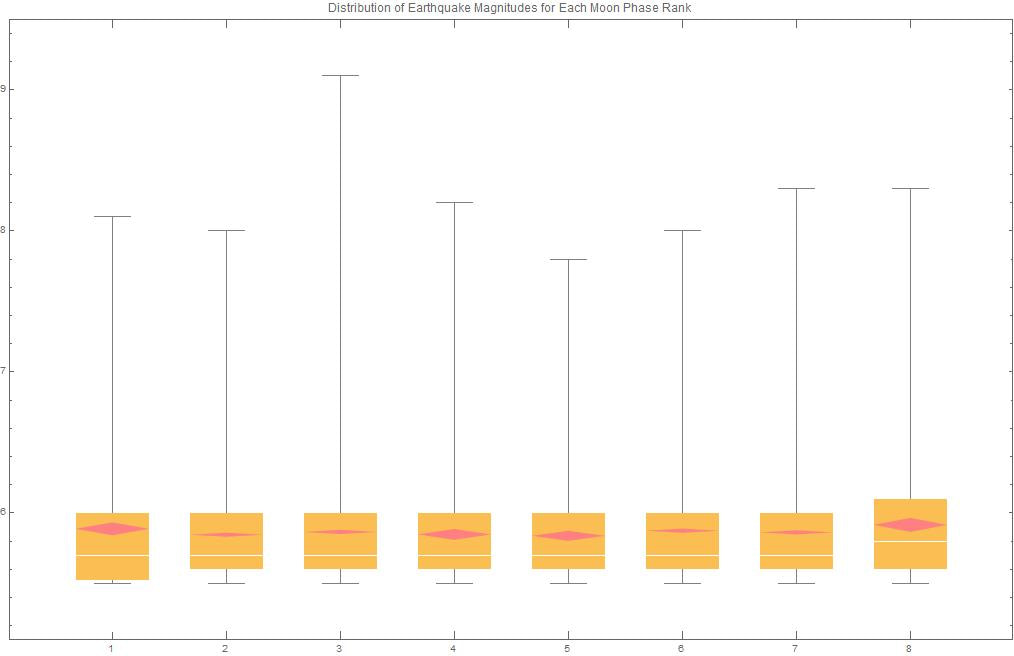
From GPower (https://stats.idre.ucla.edu/other/gpower/one-way-anova-power-analysis/), effect size is 0.0349025, alpha is 0.05 and beta is 0.9500295. Thus, these results can be considered interesting and significant enough for further study. Perhaps you are someone who needs tactile data. If so, click to enlarge the earthquake magnitude counts for moon phases 1 to 8 below. And please do confirm the results (or perform your own tests) with the following digested .csv which contains the date/time stamps of the earthquakes (all in UTC), followed for each by the moon phase ranking, and then the magnitude. (/uploads/1/1/0/9/11099376/usgs_earthquake_data.csv) usgs_earthquake_data.csvFile Size: 461 kbFile Type: csvDownload File (/uploads/1/1/0/9/11099376/usgs_earthquake_data.csv) Finally, here is the box whisker plot. The mean diamonds are depicted in pink and show the subtle upward trend from left (1) to right (8). Medians are depicted by the white horizontal lines. To conclude, a weak but highly statistically significant correlation was found between historic earthquake magnitudes and moon phase ranking*. The ranking system has to do with beginner-level general astrological principles about which phases cause the most trouble.
While more work is needed, here a basic scientific hypothesis that has stood unanswered for millennia finally gets to rest its feet for a bit. I am grateful for this sweet birthday present.